Fig. 9
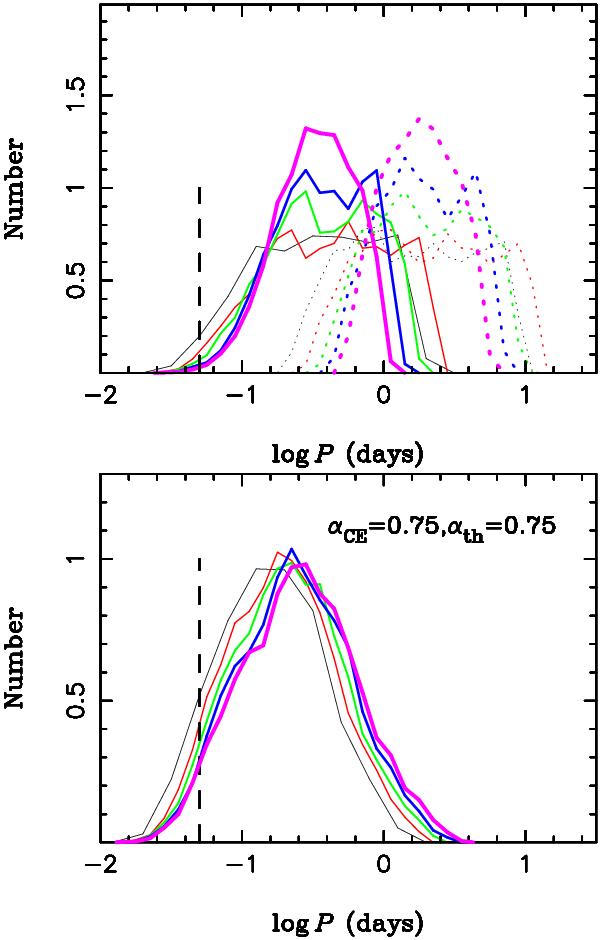
Top panel: orbital period distribution of sdB+WD binaries from the 2nd CE channel. Different colours mark different WD masses (black 0.6 M⊙, red 0.8 M⊙, green 1.0 M⊙, blue 1.2 M⊙, purple 1.4 M⊙). The vertical dashed line marks P = 0.05 d. The contribution of thermal energy has not been included (αth = 0). The solid lines are for αCE = 0.3 and the dotted ones for αCE = 1.0. Bottom panel: orbital period distribution of sdB+WD binaries from the CE channel involving more massive main sequence stars (i.e. >2 M⊙). The values of αCE and αth are indicated in the figure (see Fig. 9).
Current usage metrics show cumulative count of Article Views (full-text article views including HTML views, PDF and ePub downloads, according to the available data) and Abstracts Views on Vision4Press platform.
Data correspond to usage on the plateform after 2015. The current usage metrics is available 48-96 hours after online publication and is updated daily on week days.
Initial download of the metrics may take a while.