Fig. 5
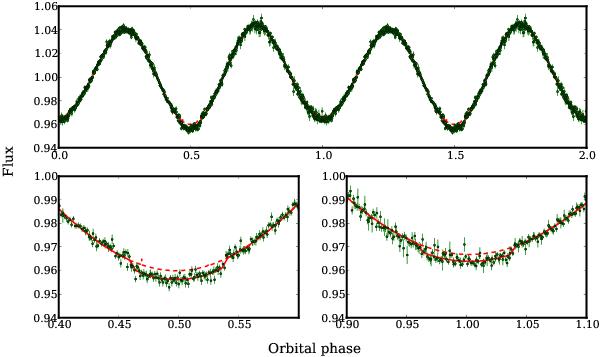
Upper panel: V-band light curve of CD-30°11223 taken with SOAR/Goodman (green) with superimposed model (red) plotted twice against the orbital phase for better visualisation. The dashed red curve marks the same model without transits and eclipses. The sinusoidal variation is caused by the ellipsoidal deformation of the hot subdwarf as a result of the tidal influence of the compact white dwarf. The difference in the maxima between phase 0.25 and 0.75 originates from the relativistic Doppler boosting effect, which is usually not detectable with ground-based telescopes. Lower panels: close-up on the transit of the WD in front of the sdB (left). It is even possible to detect the eclipse of the WD by the sdB (right).
Current usage metrics show cumulative count of Article Views (full-text article views including HTML views, PDF and ePub downloads, according to the available data) and Abstracts Views on Vision4Press platform.
Data correspond to usage on the plateform after 2015. The current usage metrics is available 48-96 hours after online publication and is updated daily on week days.
Initial download of the metrics may take a while.