Fig. 2
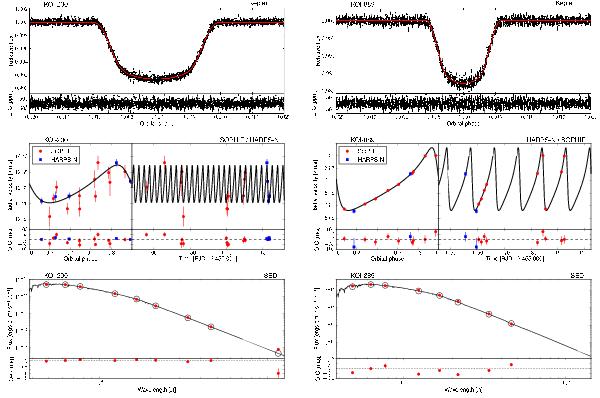
Data and best-fit models for KOI-200 (left) and KOI-889 (right). The parameters of the fits are reported in Table 4. Upper panels: Kepler phase-folded light-curve (black dots with 1-σ error bars) over-plotted with the best model (red line), and residuals. Middle panels: SOPHIE (red circles) and HARPS-N (blue squares) radial velocities and 1-σ error bars phase-folded to the orbital period of the planet (left) or as function of time (right) over-plotted with the best model (black line), and residuals. Lower panels: fitted spectral energy distribution (black line) over-plotted with measured magnitudes (red circles, Table 1) and corresponding integrated flux in each of the photometric bands according to the fit (open circles).
Current usage metrics show cumulative count of Article Views (full-text article views including HTML views, PDF and ePub downloads, according to the available data) and Abstracts Views on Vision4Press platform.
Data correspond to usage on the plateform after 2015. The current usage metrics is available 48-96 hours after online publication and is updated daily on week days.
Initial download of the metrics may take a while.