Fig. 2
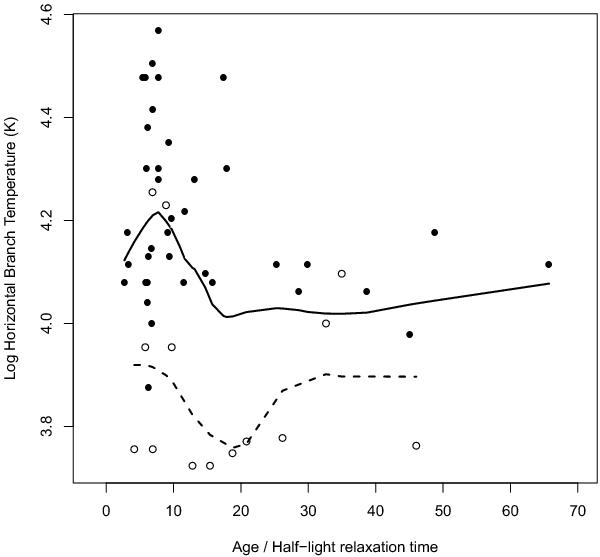
Logarithm of maximum effective HB temperature as a function of dynamical age for the R06 sample, with superimposed local polynomial regression line (solid) showing the overall trend. High-metallicity GCs (the sample’s top 25% in metallicity, i.e. the GCs with [Fe/H] ≥ −1.0) are represented by empty circles, the rest by filled circles. Temperature peaks in the 5–10 relaxation-time range, but high metallicity GCs do not follow the trend. Their trend with dynamical age is shown by the dashed line. They are generally lower in HB temperature, because the main parameter affecting their HB temperature is metallicity, not dynamical age.
Current usage metrics show cumulative count of Article Views (full-text article views including HTML views, PDF and ePub downloads, according to the available data) and Abstracts Views on Vision4Press platform.
Data correspond to usage on the plateform after 2015. The current usage metrics is available 48-96 hours after online publication and is updated daily on week days.
Initial download of the metrics may take a while.