Fig. 7
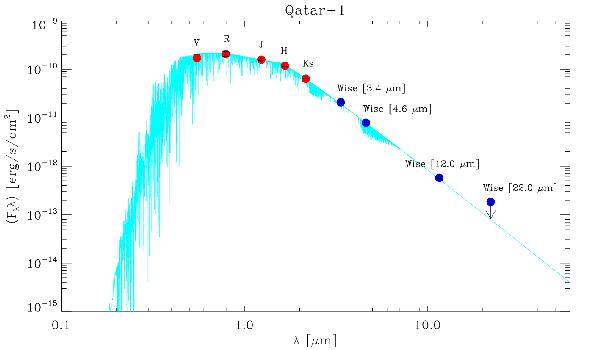
De-reddened spectral energy distribution of Qatar-1, for Av = 0.1 and d = 195 pc. Optical V and R photometric data are taken from the TASS Mark IV catalogue (Droege et al. 2006). Infrared data are taken from the 2MASS and WISE databases (Cutri et al. 2003, 2012). The NextGen synthetic low-resolution spectrum (Hauschildt et al. 1999) with the same photospheric parameters as Qatar-1 is over-plotted with a light-blue line.
Current usage metrics show cumulative count of Article Views (full-text article views including HTML views, PDF and ePub downloads, according to the available data) and Abstracts Views on Vision4Press platform.
Data correspond to usage on the plateform after 2015. The current usage metrics is available 48-96 hours after online publication and is updated daily on week days.
Initial download of the metrics may take a while.