Fig. 6
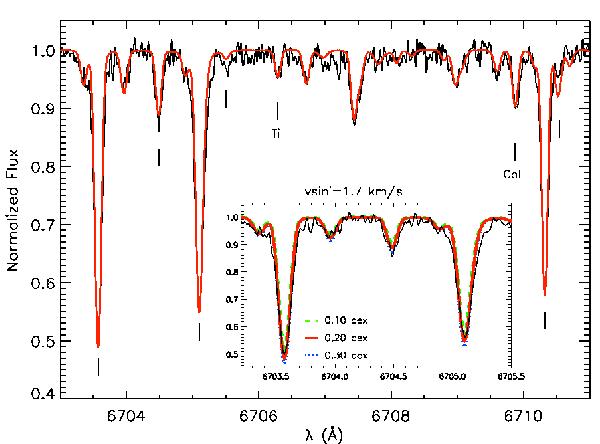
Portion of Qatar-1 average spectrum (black solid line) and synthetic spectrum (red solid line) couplcorresponding to the following set of (fixed) parameters: Teff = 4910 K, log g = 4.66, ξ = 0.90 km s-1, and vsinI = 1.7 km s-1. The positions of five iron lines and two lines of titanium and calcium are marked. The inset shows a zoom on the spectral window containing three Fe i lines, and the comparison with synthetic spectra corresponding to [Fe i/H] = 0.10 (green, long-dashed line), 0.20 (red, solid line), and 0.30 (blue, dotted line).
Current usage metrics show cumulative count of Article Views (full-text article views including HTML views, PDF and ePub downloads, according to the available data) and Abstracts Views on Vision4Press platform.
Data correspond to usage on the plateform after 2015. The current usage metrics is available 48-96 hours after online publication and is updated daily on week days.
Initial download of the metrics may take a while.