Free Access
Fig. 4
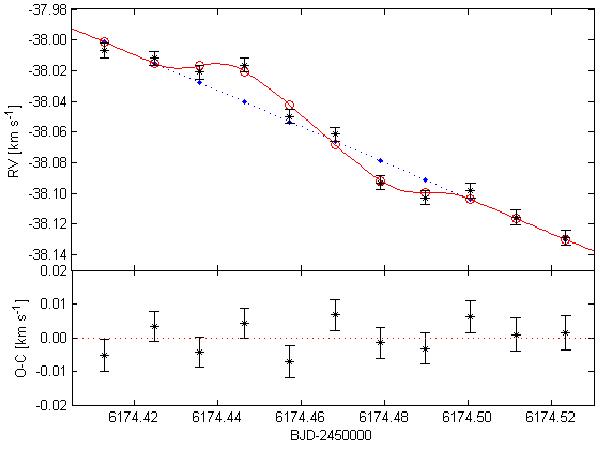
RM effect best-fit solution (solid, red line) with RV measurements (black star symbols) and computed RV values (red open circles), yielding the O−C beneath. The Keplerian radial velocity curve is also drawn as a blue dotted line.
Current usage metrics show cumulative count of Article Views (full-text article views including HTML views, PDF and ePub downloads, according to the available data) and Abstracts Views on Vision4Press platform.
Data correspond to usage on the plateform after 2015. The current usage metrics is available 48-96 hours after online publication and is updated daily on week days.
Initial download of the metrics may take a while.