Fig. 3
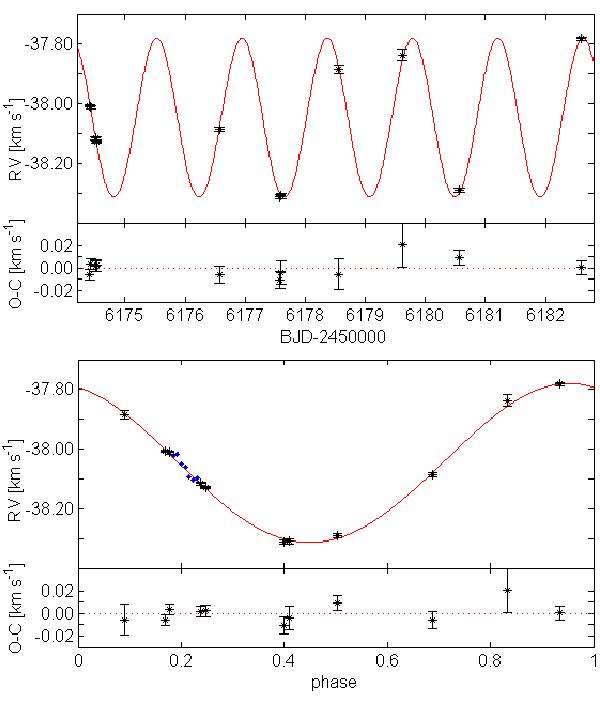
HARPS-N radial velocity data and best-fit spectroscopic orbit solution for Qatar-1. Upper panel: RV curve versus BJD showing only the out-of-transit data used for the orbital solution (solid red line), and the corresponding residuals. Lower panel: phase-folded RV curve (solid red line) and data used for the orbital fit drawn as black symbols. The RV measurements corresponding to in-transit phases are also displayed as light-blue symbols.
Current usage metrics show cumulative count of Article Views (full-text article views including HTML views, PDF and ePub downloads, according to the available data) and Abstracts Views on Vision4Press platform.
Data correspond to usage on the plateform after 2015. The current usage metrics is available 48-96 hours after online publication and is updated daily on week days.
Initial download of the metrics may take a while.