Free Access
Fig. 1
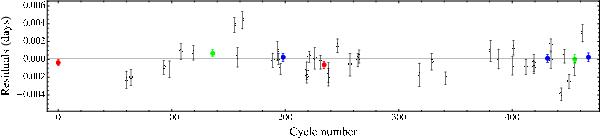
O−C diagramme for Qatar-1 transit times. The small symbols in colour refer to the Asiago (green), Calar Alto (blue) and Alsubai et al. (2011) (red) data used for redetermination of the ephemerides. Open circles represent transit times avaliable from the ETD.
Current usage metrics show cumulative count of Article Views (full-text article views including HTML views, PDF and ePub downloads, according to the available data) and Abstracts Views on Vision4Press platform.
Data correspond to usage on the plateform after 2015. The current usage metrics is available 48-96 hours after online publication and is updated daily on week days.
Initial download of the metrics may take a while.