| Issue |
A&A
Volume 554, June 2013
|
|
|---|---|---|
| Article Number | A120 | |
| Number of page(s) | 7 | |
| Section | Stellar structure and evolution | |
| DOI | https://doi.org/10.1051/0004-6361/201321283 | |
| Published online | 14 June 2013 | |
The PSR J1124-5916 wind nebula in the near-infrared⋆
1 Instituto de Astronomía, Universidad Nacional Autónoma de México, Ensenada, Mexico
e-mail:
This email address is being protected from spambots. You need JavaScript enabled to view it.
2 Ioffe Physical Technical Institute, Politekhnicheskaya 26, 194021 St. Petersburg, Russia
e-mail:
This email address is being protected from spambots. You need JavaScript enabled to view it.
3 St. Petersburg State Polytechnical Univ., Politekhnicheskaya 29, 195251 St. Petersburg, Russia
e-mail:
This email address is being protected from spambots. You need JavaScript enabled to view it.
4 Departamento de Astronomía, Universidad de Concepción, Casilla 160-C, Concepción, Chile
e-mail:
This email address is being protected from spambots. You need JavaScript enabled to view it.
Received: 12 February 2013
Accepted: 29 April 2013
Abstract
Context. The young radio pulsar J1124-5916 is associated with the Cas A like supernova remnant G292.0+1.8. It powers a compact torus-like pulsar wind nebula with a jet first detected in X-rays and then identified in the optical and mid-infrared.
Aims. We carried out deep near-infrared observations of the pulsar field to identify the pulsar and its nebula in this range.
Methods. The direct-imaging mode of the NACO adaptive optics instrument at the ESO VLT in the H and Ks bands was used.
Results. We detected a faint, H = 21.30(10) and Ks = 20.45(10), extended elliptical object in both bands, whose center position is consistent with the X-ray position of the pulsar. The morphology of the object and the orientation of its major axis agree well with those observed for the pulsar torus-like nebula in the mid-infrared, optical, and X-rays. This suggests that it is the near-infrared counterpart of the nebula. The measured fluxes compiled with the data in other ranges show a complicated unabsorbed power-law spectrum of the torus-like nebula with several steep breaks between the near-infrared and mid-infrared, the optical and X-rays, and possibly in the mid-infrared. This implies a multiple relativistic particle population responsible for the synchrotron emission of the nebula in different spectral ranges. We have not resolved the pulsar counterpart from its nebula and place only upper limits on its brightness, H ≥ 23.9 and Ks ≥ 22.7. Based on that, its contribution to the total near-infrared flux of the pulsar+nebula system is ≤ 10%, which is comparable with the expected contribution in the optical.
Key words: pulsars: general / pulsars: individual: J1124-5916 / stars: neutron / circumstellar matter
Based on observations made with ESO telescope at the Paranal Observatory under Programme 084.D-0617(A).
© ESO, 2013
1. Introduction
The young radio pulsar PSR J1124-5916 was discovered in the radio by Camilo et al. (2002) and in X-rays by Hughes et al. (2001, 2003) and was subsequently detected in γ-rays by Abdo et al. (2010). It is associated with the supernova remnant (SNR) G292.0+1.8 (MSH 11-54). The characteristic age of the pulsar τ ≈ 2900 yr and its spin-down luminosity Ė ≈ 1.2 × 1037 erg s-1 rank this pulsar as the sixth youngest and the twelfth most energetic among all rotation-powered pulsars known. The pulsar age is consistent with the 2700−3700 yr age of G292.0+1.8 (Camilo et al. 2002; Chevalier 2005). The remnant’s lower distance limit of 3.2 kpc is based on the HI absorption to beyond the tangent point in this direction (Caswell et al. 1975). An upper limit of 11 kpc follows from the pulsar’s dispersion measure (DM) of 330 pc cm2 and the Taylor & Cordes (1993) model, while 6.3 ± 0.9 kpc is considered as the most plausible distance estimate (Gaensler & Wallace 2003).
Like the Crab, PSR J1124-5916 powers a compact, ~5′′, and relatively bright torus-like X-ray pulsar wind nebula (PWN) with a jet (Hughes et al. 2001; Safi-Harb & Gonzalez 2002; Hughes et al. 2003; Park et al. 2007), which is surrounded by a fainter and more extended, 1′ × 2′, plerion visible in the radio and X-rays (Gaensler & Wallace 2003). The torus-like PWN appears to be seen nearly edge-on. Its brightest inner part, which contains the pulsar, was identified in the optical VRI bands by Zharikov et al. (2008) and then in the mid-infrared (mid-IR) at 4.5 and 8 μm (Zyuzin et al. 2009). The point-like pulsar was not resolved from the PWN in these ranges and its contribution to the total pulsar+PWN system emission was estimated to be ≲20%. The measured fluxes implied a double-knee spectral break in the power-law spectrum of the system between the optical and X-rays. This is distinct from the Crab PWN, whose spectrum shows only a single break in the same range. To obtain more stringent constraints on the optical-IR spectral energy distribution of the system, near-infrared (near-IR) observations are necessary.
Here we present the results of such observations obtained in the HKs bands with the adaptive optic (AO) system at the ESO Very Large Telescope (VLT). We also used archival optical and mid-IR data obtained with the Hubble Space Telescope (HST) and AKARI. The observations and archival data are described in Sect. 2, the results are presented and discussed in Sects. 3 and 4 and we conclude in Sect. 5.
2. VLT observations and archival data
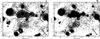 |
Fig. 1 VLT/NACO H (left) and Ks (right) images of the PSR J1124-5916 field smoothed with a Gaussian kernel of 3 × 3 pixels. The cross and circle in the H image are the X-ray pulsar position and its 1σ uncertainty. The faint object “o1” is detected in both bands and its magnitudes are accepted as stellar-like object detection limits of the images. The contours are overlaid from the V-band image (Zharikov et al. 2008). The ellipse and rectangle in the Ks image show the aperture and background region, respectively, used for the PWN photometry. |
2.1. VLT observations, data reduction and calibration
Log of the VLT/NACO observations of PSR J1124-5916.
We observed PSR J1124-5916 in service mode in March 19, 20, 22, April 1, 11 and June 17, 18 2010 from the ESO Paranal Observatory with the NAos COnica (NACO), the AO near-IR imager and spectrometer mounted at the VLT Yepun unit. To provide the best combination between angular resolution and sensitivity, we used the S27 camera, which has a pixel scale of 0 027 and a field of view (FOV) of 28′′ × 28′′. As a reference for the AO correction we used the GSC-2 star S11131211160 (V, R ~ 16 mag), located 79 away from our target. The visual dichroic element and wavefront sensor were used. The observational log is given in Table 1. The conditions were photometric with seeing varying from 06 to 13.
Day- (darks, lamp flat-fields) and night time (twilight flat-fields) calibration frames were taken daily as a part of the NACO calibration plan and used to create “master” dark and flat-field frames for each of the observational blocks (OBs). Standard data reduction of science frames, including dark subtraction, flat-fielding, cosmic-ray removal, and exposure dithering correction, was performed. To remove image backgrounds, “super-flat” frames were created for each of the OBs from a median combination of respective science images where stars were replaced by surrounding background levels. The frames were normed to unit, and the science images were then super-flat corrected, aligned to a single reference frame, and summed. At the last step we used only the best-quality individual images where stellar profile FWHMs are ≲04. This condition was satisfied for 34 H and 48 Ks frames. The resulting effective mean seeing values and integration times were 03 and 025 and 7752 s and 10944 s for the summed H and Ks images, respectively.
Photometric standards (S273-E, S363-D, S705-D) from Persson et al. (1998) were observed each night in both bands for photometric calibration. The airmass-corrected zero points provided by the NACO pipeline (Table 1) were used for photometry of several bright stars in individual science frames. Their magnitudes were then used as secondary standards for calibrating of the summed images. The resulting magnitude zero-points for the summed images are  and
and  . The errors include uncertainties of measurements and extinction coefficients, and marginal zero-point variations from night to night.
Astrometric referencing of the summed images in both bands was performed with the IRAF ccmap task. There are no suitable catalog astrometric standards in the field and several secondary astrometric standards were used instead. Their WCS coordinates were obtained from our VLT optical images of the same field referenced by Zharikov et al. (2008). Resulting rms uncertainties of the astrometric fit are ≤01 for RA and Dec.
The resulting H and Ks images are shown in Fig. 1. Conservative 3σ detection limits for a star-like object,  and
and  , were derived using standard 3σ background deviations within best aperture of radius of 8 pixels (
 ), where the signal-to-noise ratio for a stellar-like object is highest. The object marked as “o1” is one of the faintest objects reliably detected in both bands with magnitudes
  and
and  . Below we adopt these magnitudes as real detection limits.
2.2. HST archival data
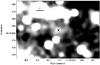 |
Fig. 2 Fragment of the HST/WFPC2/F675W archival image with the pulsar position indicated by “×”. The image is smoothed with a 7-pix Gaussian kernel to clear the PWN, which is barely resolved, while the pulsar is not. |
To verify our optical fluxes of the pulsar+PWN system obtained with the VLT (Zharikov et al. 2008) we inspected the HST archive and found two detailed observations of G292.0-1.8 in various filters with the WFPC2 in 2007 and 2008. Our system is detected at ~3σ level only in F675W filter images obtained on April 6 20081 with a total integration time of 2400 s. The data are not published. We combined the pipe-line-reduced images and show the resulting image in Fig. 2.
2.3. AKARI archival data
To update the mid-IR data on the pulsar+PWN system emission reported previously by Zyuzin et al. (2009) based on Spitzer observations, we used the AKARI archival data. The AKARI mid-IR imaging of G292.0-1.8 was carried out on January 17 20072 with the Infrared Camera (IRC) equipped with an Si:As detector array with a pixel scale of 251 and ≈10′ × 10′ FOV. The data with an analysis of the SNR emission have been published (Lee et al. 2009). For our analysis, we used only the images obtained with the filter centered on 15 μm (IRC L15) where the pulsar+PWN system is detected. The total on-source integration time was 180 s. The basic calibration and data handling, such as dark-subtraction, linearity fitting, distortion correction, flat-fielding, and image combining, were performed using the IRC imaging data reduction pipeline version 070908.
3. Results
3.1. Pulsar+PWN near-IR counterpart
An extended source is clearly detected at the pulsar+PWN position in both H and Ks bands (Fig. 1). It is elongated in the same SE-NW direction as the torus-like part of the PWN in other spectral domains (e.g., Zharikov et al. 2008). We are therefore confident that it is the real near-IR counterpart of the pulsar+PWN system. In the near-IR the PWN torus appears to be more extended, up to ≈30, than in the optical, ≈20, but is less extended than in the mid-IR, ≈105, and X-rays, ≲12 (cf., Zyuzin et al. 2009). Therefore, in the near-IR as in the optical, we see only its brightest inner part, which contains the pulsar.
For the counterpart photometry, we used an elliptical aperture with the center at the pulsar X-ray position and a rectangular box free of any sources to extract the source emission and backgrounds, respectively (Fig. 1). The resulting magnitudes are  and
and  . The real source boundary is apparently different from the pure elliptical one in various ways depending on the band. We accounted for this in the magnitude errors, which include not only statistical measurement and calibration uncertainties, but also flux variations with a random shift of the ellipse center within a circular area of ~5 pixels radius centered on the pulsar.
To complete the PWN photometry, the HST magnitude of the pulsar+PWN optical counterpart marked by “x” in Fig. 2 was estimated as  . This marginal detection is compatible with the R-band magnitude obtained by us from deeper VLT observations (Zharikov et al. 2008). The magnitude of the system estimated from the AKARI 15 μm data is m15 μm = 11
 5(2). This corresponds to the flux log Fν [μJy] = 2.6 ± 0.08. It may be overestimated because of a possible contribution of unresolved stars located near the PWN boundary, but can be taken as a confident upper limit on the system flux in this band. The measured and available observed counterpart magnitudes, fluxes in physical units, and de-reddened fluxes for a most plausible interstellar extinction range of 186 ≲ AV ≲ 210 (Zharikov et al. 2008) are collected in Table 2.
Observed magnitudes, fluxes, and de-reddened fluxes for the presumed optical/infrared PWN/pulsar counterpart of J1124-5916.
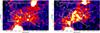 |
Fig. 3 H (left) and Ks (right) image fragments zoomed in on the X-ray pulsar position whose 1σ error is shown by the circle. The images are smoothed with a Gaussian 3 × 3 pixel kernel, and their horizontal sizes are ~4 |
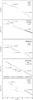 |
Fig. 4 Multiwavelength spectra of torus-like PWNe obtained with different instruments and ordered by PWN age from top to bottom. |
3.2. PWN knots and searching for the pulsar counterpart
As seen from the zoomed-in fragments of the near-IR images (Fig. 3), the PWN brightness spatial distribution is not uniform. Some relatively bright “knots”, marked as H1–H4 and K1–K5, are visible within the 1σ error-circle of the pulsar X-ray position, where the highest brightness in the optical and X-rays is located. The knots are neither resolved in the optical nor in X-rays because of a significantly lower spatial resolution or a shallow exposure, as in the HST case. This cannot be caused by the detector noise, since such structures are not visible in other image parts. Not all of them are unambiguously cross-identified in both bands, while the pairs H1/K1, H2/K2, and H4/K4 very likely have the same origins. The knot H1/K1 is located just at the PWN optical brightness maximum and could be a candidate to the pulsar counterpart. Others are probably compact synchrotron structures formed in the PWN torus, as is in the Crab case. Alternatively, the knots might be SN ejecta that have been shocked by the PWN. For instance, Zajczyk et al. (2012) reported on FeII emission from G21.9-0.9 in the 1.64 μm narrow band overlapping with the H band. It forms a shell-like structure around the G21.9-0.9 PWN X-ray boundary. Similar narrow band studies of the G292.0+1.8 field are necessary to establish whether the knots visible inside its PWN torus are related to the shocked ejecta or not. The knots could also be faint unrelated background sources projected on the PWN. However, this is very unlikely because of the much lower surface density of such sources in other parts of the field.
The local background in the PWN area is higher than that around the faintest isolated objects outside it, for instance, around source o1 in Fig. 1. This precludes us from confidently measuring the knot magnitudes relative to the local background with an accuracy of better than 03. A conservative estimate yields that their fluxes are about the same or a somewhat lower than the source o1 flux, which is firmly detected at a 5σ significance in both bands (Sect. 2.1). Based on that, the knot and pulsar brightness upper limits are Hpsr ≳  and
and  ≳
≳  . The contribution of the cross-identified knots H1/K1, H2/K2, and H4/K4 to the derived total pulsar+PWN-torus fluxes is estimated to be ≲30%. Since the SN ejecta origin of the knots is questionable and they do not dominate the entire pulsar+PWN flux, below we focus only on the analysis of the spatially integrated fluxes derived above.
4. Discussion
VLT NACO observations allowed us to detect the near-IR counterpart of the compact torus-like structure of the J1124-5916 PWN in the H and Ks bands and measure its spatially integrated fluxes. This makes J1124-5916 the fifth identified pulsar, after the Crab (Grasdalen 1979), G21.5-09 (Zajczyk et al. 2012), B540-69 (Mignani et al. 2012) and 3C 58 (Zyuzin et al., in prep.), of PWNe that were identified in the near-IR.
The high spatial resolution of ≲03 provided by the NACO allowed us to resolve the fine structure of the PWN, whose spatial brightness distribution is nonuniform. It contains several relatively bright knots located within or near the pulsar 1σ X-ray position error circle. Three of them are cross-identified in the H and Ks bands, and one of them, H1/K1, is possibly associated with the pulsar. A high PWN background precludes a confident knot flux extraction, and we derived only flux upper limits, showing that the pulsar contribution to the total pulsar+PWN flux in the near-IR is ≲10%. In addition, the AKARI and HST archival data allowed us to constrain the PWN mid-IR flux at 15 μm and confirm its optical flux. Below we discuss possible implications of the results.
4.1. Multiwavelength spectrum of the torus-like PWN
In Fig. 4 the spectrum of the J1124-5916 torus PWN compiled from the data obtained here and published previously in Zyuzin et al. (2009) is compared with available spectra3 for four other torus-like PWNe mentioned above. All of them, except for the highly absorbed G21.5-09, are also identified in the optical. The spectra are non-thermal, as expected for the synchrotron origin of the PWN emission, and can be described by power laws with different spectral indexes αν (defined as Fν ∝ ναν) depending on the spectral domain. All of them show a strong flux increase toward the low-frequency range. For the youngest Crab, and possible for G21.5-094, the increase appears to be monotonic with a gradual spectral slope decrease toward the IR5, while for the older J1124-5916 we see at least two strong spectral breaks: one is between the optical and X-rays and the other is between the near-IR and mid-IR. The third possible break exists above 15 μm with a slope flattening toward lower frequencies. A sharp, probably double-knee break between the optical and X-rays is visible in the spectrum of the similar age 3C 58 PWN (Shibanov et al. 2008)6. The spectrum of B0540-69, which is slightly older than the Crab, suggesting a break at a few microns (Mignani et al. 2012), and then flattens again at longer wavelengths (Williams et al. 2008). A double-knee break between the optical and X-rays is not excluded either (Serafimovich et al. 2005). At the same time, the IR part of the G21.5-09 spectrum is probably almost flat7, implying at least one break between the IR and X-rays (Zajczyk et al. 2012).
We can conclude that the presence of several prominent spectral breaks in the IR-optical-X-ray range is a common feature for torus-like PWNe. This cannot be excluded even for the Crab, where, in addition to the significant X-ray-optical slope change, some small breaks may exist between the optical and near-IR and/or between the near-IR and mid-IR (Arendt et al. 2011). In Fig. 4 the breaks apparently become stronger with PWN age. However, this apparent spectral evolution trend has to be considered with a caution, since the spectrum of the Crab is dominated by the small torus region only in X-rays, while at low frequencies it includes the emission from the whole plerion, resulting in the smoothness of the spectrum. The same problem is not solved yet for the Crab “twin”, B0540-69, whose PWN torus is not yet firmly resolved and whose position and orientation are still debated (De Luca et al. 2007; Lundqvist et al. 2011).
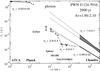 |
Fig. 5 Comparison of the spatially integrated multiwavelength spectra of the J1124-5916 PWN for the compact PWN torus (lower curves) and for the much more extended plerion (upper curves) obtained with different instruments, as notified in the plot. The radio and submillimeter data for the plerion are taken from Gaensler & Wallace (2003) and from the Planck Collaboration (2011), respectively. 1σ X-ray uncertainties for each of the spectrum are indicated by hatched regions and are extended toward the low-frequency range. The torus is not detected in the radio, while the plerion is not identified in the IR. |
H and Ks magnitudes, near-IR luminosities LIR, and radiation efficiencies ηIR of radio pulsars observed in the near-IR.
It is evident that the compact torus-like PWN works as an energy injector for the large-scale plerion. As mentioned by Gaensler & Wallace (2003), the spectrum of the J1124-5916 large-scale plerion has a single spectral break between the radio and X-rays with Δαν ~ 1 at a relatively low-frequency range of ≲ 800 GHz. The Planck early-release compact source catalog8 allows us to constrain the break position near 70 GHz more precisely, where the plerion flux of (4.1 ± 0.2) mJy becomes significantly lower than that of (5.3 ± 0.1) mJy at 5 GHz measured previously, and continues to drop rapidly with the frequency (e.g., (2.1 ± 0.1) mJy at 217 GHz; Fig. 5). In Fig. 5 the X-ray spectrum of the G292.0+1.8 plerion was obtained using the data from the Chandra archive9. We reprocessed “level 1” data with CIAO chandra_repro script and used the spectral interval of 5−10 keV to exclude the G292.0+1.8 thermal component that strongly dominates the nonthermal plerion spectrum at lower energies. The spectrum was extracted using a source aperture of 11 centered on the pulsar, background was taken outside the SNR, and fitted by a single absorbed power law with a resulting slope αν = − 1.0(1). The low-frequency spectral break of the plerion cannot be simply explained by synchrotron losses of a single-particle population (Gaensler & Wallace 2003), suggesting, as in the Crab (Kennel & Coroniti 1984) and 3C 58 (Slane et al. 2008) cases, distinct populations for the radio and X-ray emission of the plerion. The observed multiple spectral breaks in the torus emission serve as direct evidence of a complicated spectrum of the injected particles, which cannot be described by a simple model of an unbroken power-law. This fact can help us to better understand the nature of the low-frequency break of the large-scale plerion for J1124-5916 and similar breaks for other PWNe. To do that, more detailed observations of PWNe and modeling of these systems are necessary.
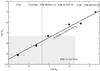 |
Fig. 6 Correlation between the optical (B band) and near-IR (H band) efficiencies of radio pulsars. The optical data are taken from Zharikov et al. (2006). |
4.2. Pulsar flux upper limits and efficiencies
In Table 3 we summarize observed H, Ks magnitudes, respective luminosities, and radiation efficiencies η = LIR/Ė of rotation-powered pulsars detected in the near-IR and optical bands. The H vs. B band efficiency plot (Fig. 6) shows a strong correlation between the optical and near-IR efficiencies. This confirms a common origin of radiation in the near-IR and the optical, resulting also from rather smooth pulsar spectral energy distributions in these ranges. The ηH ∝ ηB empirical relationship derived from the plot (thick solid line) allows one to predict IR magnitudes for all pulsars that have been detected in the optical, but not yet in the near-IR, and vice versa.
Based on the observed PSR J1124-5916 flux upper limits in the near-IR obtained here and in the optical provided by Zharikov et al. (2008), we can constrain the pulsar position region on the efficiency plain (shaded region in Fig. 6) and conclude that its efficiencies are at least lower than those of younger pulsars. The ηH ∝ ηB relationship and the H-band limit suggest that the pulsar cannot be more efficient than the middle-aged PSR B0656+14, and allows us to better constrain its ηB (vertical dashed line) than it was possible from our optical observations. We predict that its de-reddened B ≥ 268. This also means that the pulsar contribution to the total pulsar+PWN optical flux is ≤ 10%, as in the near-IR.
5. Conclusions
Using the NACO at the VLT, we performed the deepest near-IR observations of the young pulsar J1124-5916 field to date. In the H and Ks bands we detected a faint H = 21.30(10), Ks = 20.45(10) extended elliptical object, whose center position is consistent with the X-ray position of the pulsar. The morphology of the object and the orientation of its major axis agree well with those for the J1124-5916 torus-like PWN obtained in the optical and X-rays. This allowed us to conclude that we detected the near-IR counterpart of the PWN. The compiled IR-optical-X-ray power-law spectrum of the torus-like PWN shows several spectral breaks, implying that a multiple population of relativistic particles is responsible for the emission in different spectral domains. This may help to explain the single low-frequency break in the radio-X-ray spectrum of the large-scale plerion of J1124-5916, which is impossible to describe by a single-particle population. The presence of several spectral breaks appears to be a common feature for the spectra of all torus-like PWNe.
We found several faint knot-like objects near the X-ray position of the pulsar. The PWN background is high in this area, which prevented us from concluding confidently about their origin. We derived the upper limits for the pulsar near-IR fluxes and estimated its contribution to the total pulsar+PWN flux in this range at a level of ≤ 10%. Compared with other pulsars observed in the near-IR and optical, we conclude that the expected pulsar contribution in the optical does not exceed this level either. Deeper high-spatial resolution optical and near-IR observations are necessary to resolve the pulsar from its PWN.
GO 10916, PI R. Fesen.
Observation ID 1400749, PI H. Kaneda.
The data are taken for the Crab from Green et al. (2004), Temim et al. (2006), Grasdalen (1979), Veron-Cetty & Woltjer (1993), and Kirsch et al. (2005); for G21.5-0.9 from Zajczyk et al. (2012); for B0540-69.3 from Manchester et al. (1993), Williams et al. (2008), Mignani et al. (2012), and Serafimovich et al. (2005); for 3C 58 from Shibanov et al. (2008), Shearer & Neustroev (2008), and Slane et al. (2008).
We indicate in the plot the SNR (870 yr, Bietenholz & Bartel 2008) and spindown (4800 yr, Camilo et al. 2006) ages for this PWN.
A mid-IR bump over the power-law fit in the Crab spectrum in the mid-IR at ~50 μm is due to thermal emission from the warm dust generated by the SN (Temim et al. 2006; Arendt et al. 2011; Temim et al. 2012).
The optical-IR part of the 3C 58 torus spectrum is confirmed by near-UV and near-IR observations (Zyuzin et al., in prep.).
We remeasured the Spitzer fluxes for this PWN and found a good agreement with Zajczyk et al. (2012) for all bands except for 24 μm, where our flux of (1.58 ± 0.81) mJy is lower by a factor of 3 than their value and consistent with the flatter spectral index derived using lower wavelength bands. The reasons for the discrepancy are unclear, and in Fig. 4 we show both measurements for this band and the respective fits.
ID 6677, PI S. Park.
Acknowledgments
The work was partially supported by CONACYT 151858 projects and by the Russian Foundation for Basic Research (grants 11-02-00253 and 13-02-12017-ofi-m), RF Presidential Program (Grant NSh 4035.2012.2). R.E.M. acknowledges support by the BASAL Centro de Astrofisica y Tecnologias Afines (CATA) PFB–06/2007.
References
- Abdo, A. A., Ackermann, M., Ajello, M., et al. 2010, ApJS, 187, 460 [NASA ADS] [CrossRef] [Google Scholar]
- Arendt, R. G., George, J. V., Staguhn, J. G., et al. 2011, ApJ, 734, 54 [NASA ADS] [CrossRef] [Google Scholar]
- Bietenholz, M. F., & Bartel, N. 2008, MNRAS, 386, 1411 [NASA ADS] [CrossRef] [Google Scholar]
- Camilo, F., Manchester, R. N., Gaensler, B. M., Lorimer, D. R., & Sarkissian, J. 2002, ApJ, 567, L71 [NASA ADS] [CrossRef] [Google Scholar]
- Camilo, F., Ransom, S. M., Gaensler, B. M., et al. 2006, ApJ, 637, 456 [NASA ADS] [CrossRef] [Google Scholar]
- Caswell, J. L., Murray, J. D., Roger, R. S., Cole, D. J., & Cooke, D. J. 1975, A&A, 45, 239 [NASA ADS] [Google Scholar]
- Chevalier, R. A. 2005, ApJ, 619, 839 [NASA ADS] [CrossRef] [Google Scholar]
- De Luca, A., Mignani, R. P., Caraveo, P. A., & Bignami, G. F. 2007, ApJ, 667, L77 [NASA ADS] [CrossRef] [Google Scholar]
- Gaensler, B. M., & Wallace, B. J. 2003, ApJ, 594, 326 [NASA ADS] [CrossRef] [Google Scholar]
- Grasdalen, G. L. 1979, PASP, 91, 436 [NASA ADS] [CrossRef] [Google Scholar]
- Green, D. A., Tuffs, R. J., & Popescu, C. C. 2004, MNRAS, 355, 1315 [NASA ADS] [CrossRef] [Google Scholar]
- Hughes, J. P., Slane, P. O., Burrows, D. N., et al. 2001, ApJ, 559, L153 [NASA ADS] [CrossRef] [Google Scholar]
- Hughes, J. P., Slane, P. O., Park, S., Roming, P. W. A., & Burrows, D. N. 2003, ApJ, 591, L139 [NASA ADS] [CrossRef] [Google Scholar]
- Kaplan, D. L., & Moon, D.-S. 2006, ApJ, 644, 1056 [NASA ADS] [CrossRef] [Google Scholar]
- Kennel, C. F., & Coroniti, F. V. 1984, ApJ, 283, 710 [NASA ADS] [CrossRef] [Google Scholar]
- Kirsch, M. G., Briel, U. G., Burrows, D., et al. 2005, in SPIE Conf. Ser. 5898, ed. O. H. W. Siegmund, 22 [Google Scholar]
- Koptsevich, A. B., Pavlov, G. G., Zharikov, S. V., et al. 2001, A&A, 370, 1004 [NASA ADS] [CrossRef] [EDP Sciences] [Google Scholar]
- Lee, H.-G., Koo, B.-C., Moon, D.-S., et al. 2009, ApJ, 706, 441 [NASA ADS] [CrossRef] [Google Scholar]
- Lundqvist, N., Lundqvist, P., Björnsson, C.-I., et al. 2011, MNRAS, 413, 611 [NASA ADS] [CrossRef] [Google Scholar]
- Manchester, R. N., Staveley-Smith, L., & Kesteven, M. J. 1993, ApJ, 411, 756 [NASA ADS] [CrossRef] [Google Scholar]
- Mignani, R. P., De Luca, A., Hummel, W., et al. 2012, A&A, 544, A100 [NASA ADS] [CrossRef] [EDP Sciences] [Google Scholar]
- Park, S., Hughes, J. P., Slane, P. O., et al. 2007, ApJ, 670, L121 [NASA ADS] [CrossRef] [Google Scholar]
- Persson, S. E., Murphy, D. C., Krzeminski, W., Roth, M., & Rieke, M. J. 1998, AJ, 116, 2475 [NASA ADS] [CrossRef] [Google Scholar]
- Planck Collaboration 2011, A&A, 536, A7 [NASA ADS] [CrossRef] [EDP Sciences] [Google Scholar]
- Safi-Harb, S., & Gonzalez, M. E. 2002, in The High Energy Universe at Sharp Focus: Chandra Science, eds. E. M. Schlegel, & S. D. Vrtilek, ASP Conf. Ser., 262, 315 [Google Scholar]
- Serafimovich, N. I., Lundqvist, P., Shibanov, Y. A., & Sollerman, J. 2005, Adv. Space Res., 35, 1106 [NASA ADS] [CrossRef] [Google Scholar]
- Shearer, A., & Neustroev, V. V. 2008, MNRAS, 390, 235 [NASA ADS] [CrossRef] [Google Scholar]
- Shibanov, Y. A., Koptsevich, A. B., Sollerman, J., & Lundqvist, P. 2003, A&A, 406, 645 [NASA ADS] [CrossRef] [EDP Sciences] [Google Scholar]
- Shibanov, Y. A., Lundqvist, N., Lundqvist, P., Sollerman, J., & Zyuzin, D. 2008, A&A, 486, 273 [NASA ADS] [CrossRef] [EDP Sciences] [Google Scholar]
- Slane, P., Helfand, D. J., Reynolds, S. P., et al. 2008, ApJ, 676, L33 [NASA ADS] [CrossRef] [Google Scholar]
- Sollerman, J. 2003, A&A, 406, 639 [NASA ADS] [CrossRef] [EDP Sciences] [Google Scholar]
- Taylor, J. H., & Cordes, J. M. 1993, ApJ, 411, 674 [NASA ADS] [CrossRef] [Google Scholar]
- Temim, T., Gehrz, R. D., Woodward, C. E., et al. 2006, AJ, 132, 1610 [NASA ADS] [CrossRef] [Google Scholar]
- Temim, T., Sonneborn, G., Dwek, E., et al. 2012, ApJ, 753, 72 [NASA ADS] [CrossRef] [Google Scholar]
- Veron-Cetty, M. P., & Woltjer, L. 1993, A&A, 270, 370 [NASA ADS] [Google Scholar]
- Williams, B. J., Borkowski, K. J., Reynolds, S. P., et al. 2008, ApJ, 687, 1054 [NASA ADS] [CrossRef] [Google Scholar]
- Zajczyk, A., Gallant, Y. A., Slane, P., et al. 2012, A&A, 542, A12 [NASA ADS] [CrossRef] [EDP Sciences] [Google Scholar]
- Zharikov, S., Shibanov, Y., & Komarova, V. 2006, Adv. Space Res., 37, 1979 [Google Scholar]
- Zharikov, S. V., Shibanov, Y. A., Zyuzin, D. A., Mennickent, R. E., & Komarova, V. N. 2008, A&A, 492, 805 [NASA ADS] [CrossRef] [EDP Sciences] [Google Scholar]
- Zyuzin, D. A., Danilenko, A. A., Zharikov, S. V., & Shibanov, Y. A. 2009, A&A, 508, 855 [NASA ADS] [CrossRef] [EDP Sciences] [Google Scholar]
All Tables
Observed magnitudes, fluxes, and de-reddened fluxes for the presumed optical/infrared PWN/pulsar counterpart of J1124-5916.
H and Ks magnitudes, near-IR luminosities LIR, and radiation efficiencies ηIR of radio pulsars observed in the near-IR.
All Figures
|
Fig. 1 VLT/NACO H (left) and Ks (right) images of the PSR J1124-5916 field smoothed with a Gaussian kernel of 3 × 3 pixels. The cross and circle in the H image are the X-ray pulsar position and its 1σ uncertainty. The faint object “o1” is detected in both bands and its magnitudes are accepted as stellar-like object detection limits of the images. The contours are overlaid from the V-band image (Zharikov et al. 2008). The ellipse and rectangle in the Ks image show the aperture and background region, respectively, used for the PWN photometry. |
| In the text | |
|
Fig. 2 Fragment of the HST/WFPC2/F675W archival image with the pulsar position indicated by “×”. The image is smoothed with a 7-pix Gaussian kernel to clear the PWN, which is barely resolved, while the pulsar is not. |
| In the text | |
|
Fig. 3 H (left) and Ks (right) image fragments zoomed in on the X-ray pulsar position whose 1σ error is shown by the circle. The images are smoothed with a Gaussian 3 × 3 pixel kernel, and their horizontal sizes are ~4 |
| In the text | |
|
Fig. 4 Multiwavelength spectra of torus-like PWNe obtained with different instruments and ordered by PWN age from top to bottom. |
| In the text | |
|
Fig. 5 Comparison of the spatially integrated multiwavelength spectra of the J1124-5916 PWN for the compact PWN torus (lower curves) and for the much more extended plerion (upper curves) obtained with different instruments, as notified in the plot. The radio and submillimeter data for the plerion are taken from Gaensler & Wallace (2003) and from the Planck Collaboration (2011), respectively. 1σ X-ray uncertainties for each of the spectrum are indicated by hatched regions and are extended toward the low-frequency range. The torus is not detected in the radio, while the plerion is not identified in the IR. |
| In the text | |
|
Fig. 6 Correlation between the optical (B band) and near-IR (H band) efficiencies of radio pulsars. The optical data are taken from Zharikov et al. (2006). |
| In the text | |
Current usage metrics show cumulative count of Article Views (full-text article views including HTML views, PDF and ePub downloads, according to the available data) and Abstracts Views on Vision4Press platform.
Data correspond to usage on the plateform after 2015. The current usage metrics is available 48-96 hours after online publication and is updated daily on week days.
Initial download of the metrics may take a while.