Fig. 7
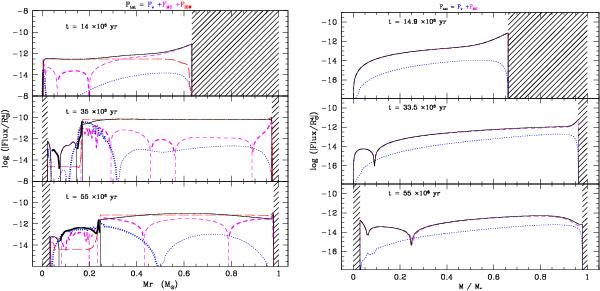
Decomposition of the total flux of angular momentum (solid black) into meridional circulation (long-dashed magenta), shear turbulence (dotted blue), and IGW (short-dashed red) in the 1 M⊙ models computed with and without IGW (left and right panels respectively). Bold lines indicate negative values for the fluxes  ,
,  , or
, or  , when angular momentum is transported towards the central regions by the corresponding mechanism; in the case of meridional circulation and of shear turbulence this corresponds respectively to clockwise currents (U2 > 0) and to a positive Ω gradient. The profiles are shown at three different ages along the PMS. Shaded areas correspond to convective regions.
Current usage metrics show cumulative count of Article Views (full-text article views including HTML views, PDF and ePub downloads, according to the available data) and Abstracts Views on Vision4Press platform.
Data correspond to usage on the plateform after 2015. The current usage metrics is available 48-96 hours after online publication and is updated daily on week days.
Initial download of the metrics may take a while.