Fig. 4
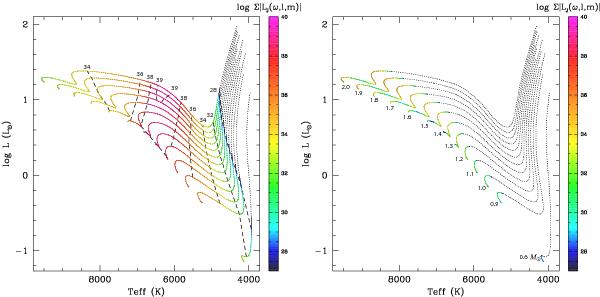
Same as Fig. 1, but with colors indicating the total momentum flux carried by IGW generated by the convective envelope (left) and the convective core (right). Dotted lines indicate the region where the stars are fully convective (left) or have no convective core (right) so that no IGW can be generated. In the left panel the vertical dashed lines connect models where the excitation has the same value: log (Σ | ℱJ(ω,l,m) | ) = 28, 30, 32, 34, 36, 38.
Current usage metrics show cumulative count of Article Views (full-text article views including HTML views, PDF and ePub downloads, according to the available data) and Abstracts Views on Vision4Press platform.
Data correspond to usage on the plateform after 2015. The current usage metrics is available 48-96 hours after online publication and is updated daily on week days.
Initial download of the metrics may take a while.