Fig. 7
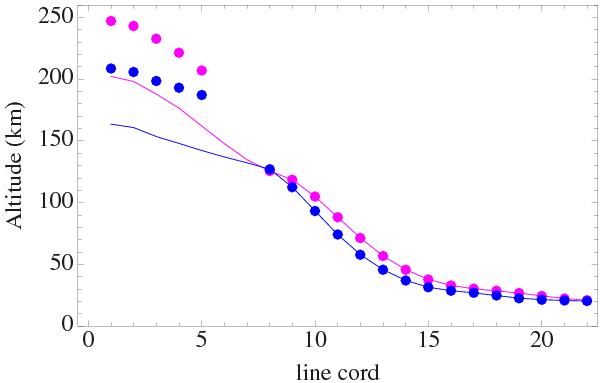
Formation height above the 500 nm continuum level as a function of the line-cord index. Magenta dots and curve: FeI 630.1 nm line; blue dots and curve: FeI 630.2 nm line. Full lines show the uncorrected results, the discontinuity of the slope at index 8 is an artifact due to measurement difficulties in the contrast inversion layer. Dots show the results corrected for the inversion layer discontinuity, as explained in the text.
Current usage metrics show cumulative count of Article Views (full-text article views including HTML views, PDF and ePub downloads, according to the available data) and Abstracts Views on Vision4Press platform.
Data correspond to usage on the plateform after 2015. The current usage metrics is available 48-96 hours after online publication and is updated daily on week days.
Initial download of the metrics may take a while.