Fig. 6
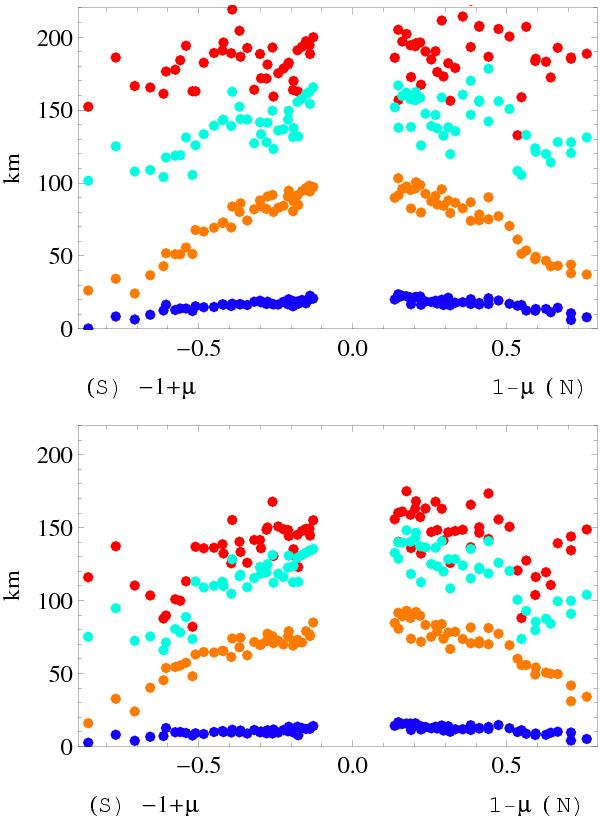
Perspective shifts measured between the continuum and images at four line levels as function of 1 − μ in the northern hemisphere, and − (1 − μ) in the southern hemisphere. Upper panel: results for the Fe1 630.1 nm line. Lower panel: results for the Fe2 630.2 nm. Red dots: line centers (level 1), light -blue dots: level 5, orange dots: line level 10, deep-blue dots: level 15.
Current usage metrics show cumulative count of Article Views (full-text article views including HTML views, PDF and ePub downloads, according to the available data) and Abstracts Views on Vision4Press platform.
Data correspond to usage on the plateform after 2015. The current usage metrics is available 48-96 hours after online publication and is updated daily on week days.
Initial download of the metrics may take a while.