Fig. 5
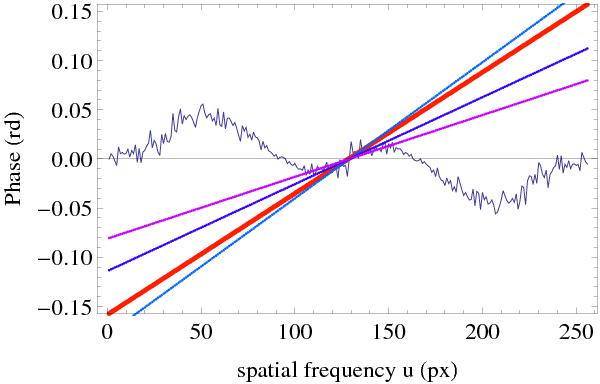
Phase of the cross-spectrum of an image observed in the continuum and a numerically displaced image with a contrast inversion at high spatial frequencies. The red linear curve shows the phase corresponding to the imposed displacement of 0.05 pixel. The spatial frequency zero is at pixel 129. The cyan, blue, and magenta lines show how the measured slope would vary according to the width of the linear fitting interval at the origin, namely ±5 pixels, ±15 pixels and ±25 pixels, respectively.
Current usage metrics show cumulative count of Article Views (full-text article views including HTML views, PDF and ePub downloads, according to the available data) and Abstracts Views on Vision4Press platform.
Data correspond to usage on the plateform after 2015. The current usage metrics is available 48-96 hours after online publication and is updated daily on week days.
Initial download of the metrics may take a while.