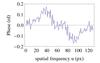
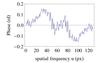
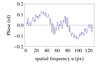
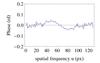
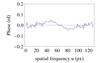
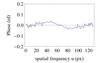
Fig. 4
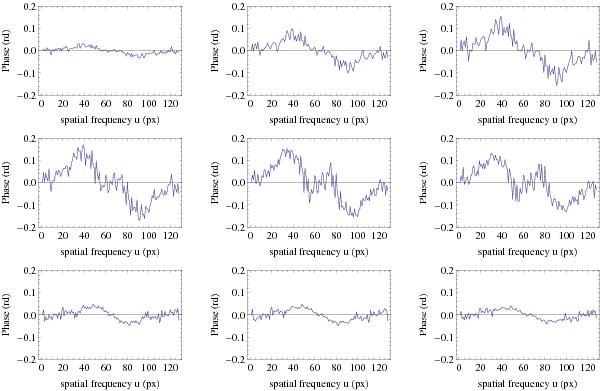
Phase (in radian) of the cross-spectrum of images at successive levels in the FeI 630.1 nm, measured at μ = 0.776 as a function of the spatial frequency given in pixel units. The frequency zero is at pixel 65. Upper row, from left to right: cross-spectra of images at levels 1 and 2, 2 and 3, and 3 and 4. Middle row, from left to right: cross-spectra of images at levels 4 and 5, 5 and 6, 6 and 7 (note the effect of contrast inversion), lower row, from left to right: cross-spectra of images at levels 11 and 12, 12 and 13, 13 and 14.
Current usage metrics show cumulative count of Article Views (full-text article views including HTML views, PDF and ePub downloads, according to the available data) and Abstracts Views on Vision4Press platform.
Data correspond to usage on the plateform after 2015. The current usage metrics is available 48-96 hours after online publication and is updated daily on week days.
Initial download of the metrics may take a while.