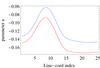
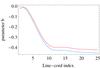
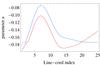
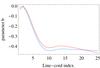
Fig. 3
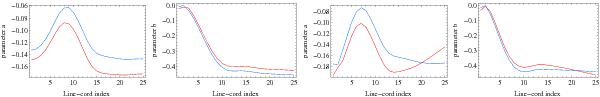
Parameters a and b of the parabolic fits of the mean intensity CLV as functions of the line-cord index. Upper panels: a and b parameters for the FeI 630.1 nm line; lower panels: a and b parameters for the FeI 630.2 nm line. Values measured in the northern and in the southern hemispheres are shown in red and blue, respectively.
Current usage metrics show cumulative count of Article Views (full-text article views including HTML views, PDF and ePub downloads, according to the available data) and Abstracts Views on Vision4Press platform.
Data correspond to usage on the plateform after 2015. The current usage metrics is available 48-96 hours after online publication and is updated daily on week days.
Initial download of the metrics may take a while.