Free Access
Fig. 2
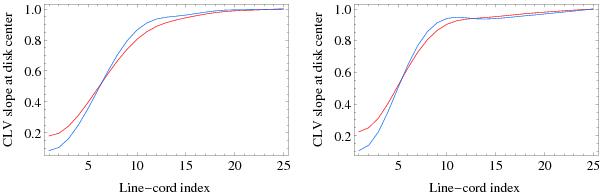
Slope of the mean intensity CLV in the FeI 630.15 nm (left panel) and in the FeI 630.25 nm (right panel) measured at disk center for the 25 line cords, and normalized to 1 at level 25. Values fitting the northern and southern hemisphere measurements are shown in red and in blue, respectively.
This figure is made of several images, please see below:
Current usage metrics show cumulative count of Article Views (full-text article views including HTML views, PDF and ePub downloads, according to the available data) and Abstracts Views on Vision4Press platform.
Data correspond to usage on the plateform after 2015. The current usage metrics is available 48-96 hours after online publication and is updated daily on week days.
Initial download of the metrics may take a while.