Fig. 1
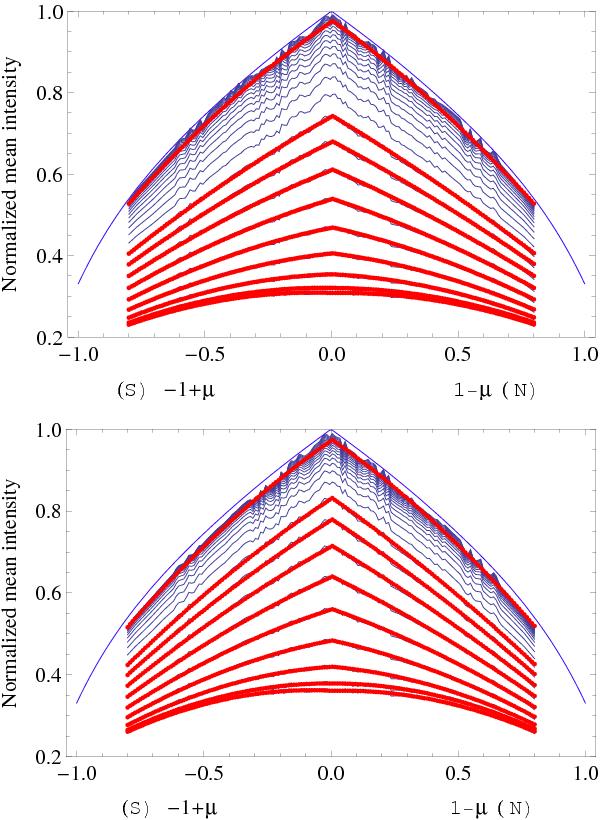
Center-to-limb variations of the mean intensity of the photosphere at 25 line-levels, normalized to the mean intensity of the continuum at disk center. Upper panel: FeI 630.1 nm line; lower panel: FeI 630.2 nm. The right sides of the figures show the measurements performed in the northern hemisphere as functions of 1 − cosθ (0 at disk center), the left sides show the results for the southern hemisphere as funtions of − (1 − cosθ). From the lower curve to the top one the line-cord index varies from 1 to 25 (line center to continuum level). Parabolic fittings (in red) are superimposed to the observed curves at line cords 1 to 9 and 20. The thin smooth line shows the fifth-order polynomial fitting of the continuum mean intensity, as given by Neckel (2005).
Current usage metrics show cumulative count of Article Views (full-text article views including HTML views, PDF and ePub downloads, according to the available data) and Abstracts Views on Vision4Press platform.
Data correspond to usage on the plateform after 2015. The current usage metrics is available 48-96 hours after online publication and is updated daily on week days.
Initial download of the metrics may take a while.