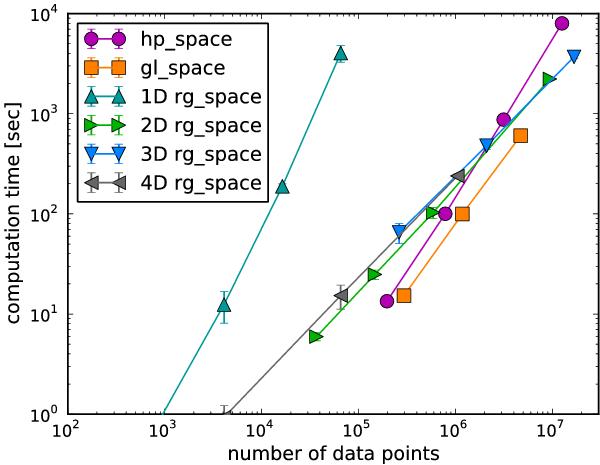
Fig. 2

Illustration of the performance of the Wiener filter code given in Appendix C showing computation time against the size of the data set (ranging from 512 to 256 × 256 × 256 data points) for different signal spaces (see legend). The markers show the average runtime of multiple runs, and the error bars indicate their variation. (Related markers are solely connected to guide the eye.)
Current usage metrics show cumulative count of Article Views (full-text article views including HTML views, PDF and ePub downloads, according to the available data) and Abstracts Views on Vision4Press platform.
Data correspond to usage on the plateform after 2015. The current usage metrics is available 48-96 hours after online publication and is updated daily on week days.
Initial download of the metrics may take a while.


