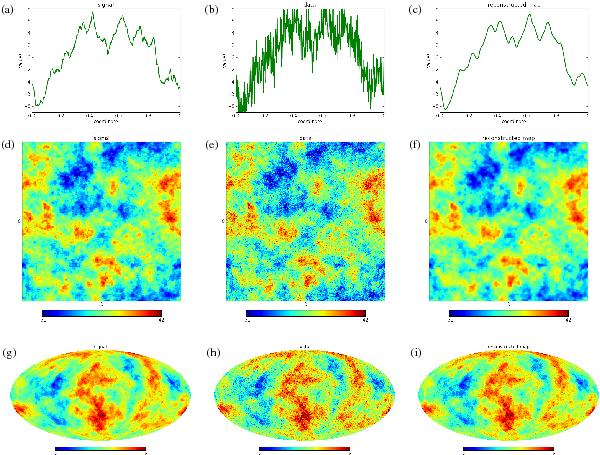
Fig. 1

Illustration of the Wiener filter code example showing (left to
right) a Gaussian random signal a), d), g), the data including noise
(b,e,h), and the reconstructed map (c,f,i). The additive Gaussian white noise has a
variance  that sets
a signal-to-noise ratio
⟨σs⟩Ω/σn
of roughly 2. The same code has been applied to three different spaces (top to
bottom), namely a 1D regular grid with 512 pixels (a,b,c), a 2D regular
grid with 256 × 256 pixels (d,e,f), and a HEALPix grid with
nside = 128 corresponding to 196 608 pixels on the
 sphere (g,h,i). (All figures have been created by NIFTy using the field.plot
method.)
Current usage metrics show cumulative count of Article Views (full-text article views including HTML views, PDF and ePub downloads, according to the available data) and Abstracts Views on Vision4Press platform.
Data correspond to usage on the plateform after 2015. The current usage metrics is available 48-96 hours after online publication and is updated daily on week days.
Initial download of the metrics may take a while.


