Free Access
Fig. 3
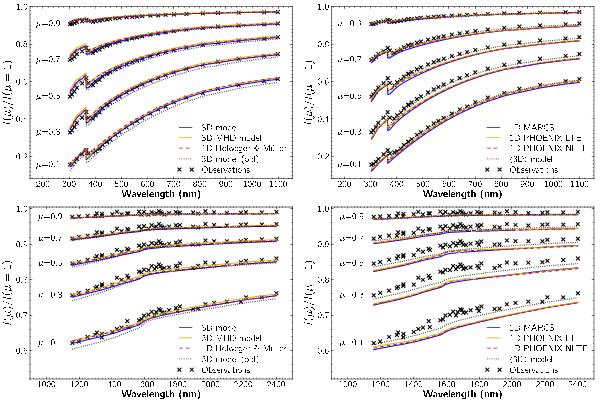
CLVs in the continuum intensity. Top panels: comparison with the visible/infrared observations of Neckel & Labs (1994). Bottom panels: comparison with the near-infrared observations of Pierce et al. (1977), for wavelengths between 1158.35−2401.8 nm.
Current usage metrics show cumulative count of Article Views (full-text article views including HTML views, PDF and ePub downloads, according to the available data) and Abstracts Views on Vision4Press platform.
Data correspond to usage on the plateform after 2015. The current usage metrics is available 48-96 hours after online publication and is updated daily on week days.
Initial download of the metrics may take a while.