Fig. 14
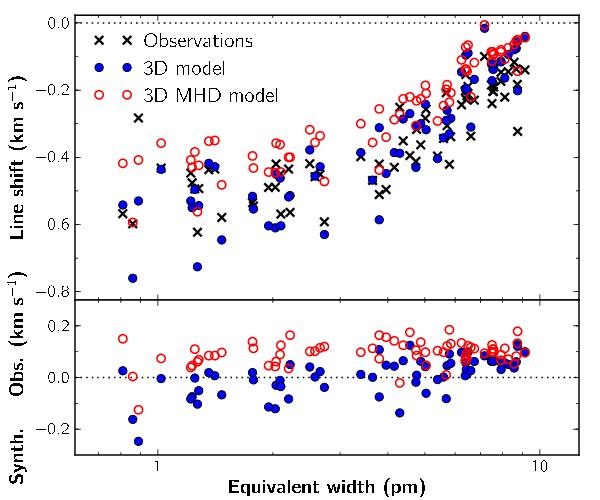
Upper panel: observed (crosses) line shifts for a sample of Fe i and Fe ii lines for disk-centre intensity as a function of line strength together with predictions from the 3D model (blue, filled circles) and the 3D MHD (100 Gauss) model (red, open circles). Lower panel: differences between predicted and observed line shifts.
Current usage metrics show cumulative count of Article Views (full-text article views including HTML views, PDF and ePub downloads, according to the available data) and Abstracts Views on Vision4Press platform.
Data correspond to usage on the plateform after 2015. The current usage metrics is available 48-96 hours after online publication and is updated daily on week days.
Initial download of the metrics may take a while.