Fig. 12
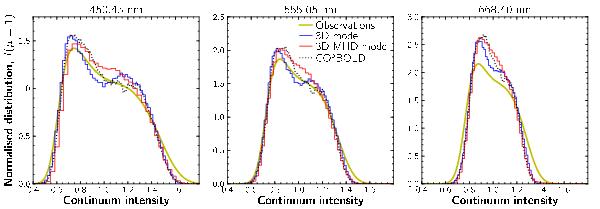
Continuum intensity distributions for the solar disk-centre for three wavelengths, as a function of the normalised continuum intensity for the 3D model (thin blue solid line), the 3D MHD model (thin red solid line), compared with observations (thick yellow line). Also shown is the prediction from the CO5BOLD 3D solar model (dotted line) taken from Fig. 5 of WR09. The intensity distributions for our 3D models were averaged over all the snapshots.
Current usage metrics show cumulative count of Article Views (full-text article views including HTML views, PDF and ePub downloads, according to the available data) and Abstracts Views on Vision4Press platform.
Data correspond to usage on the plateform after 2015. The current usage metrics is available 48-96 hours after online publication and is updated daily on week days.
Initial download of the metrics may take a while.