Free Access
Fig. 1
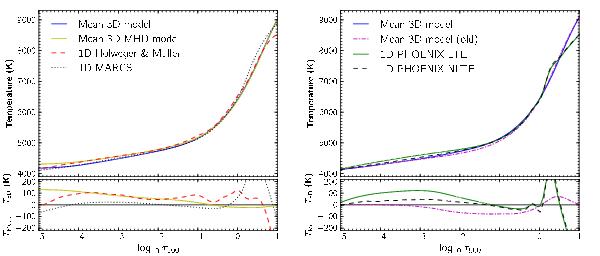
Temperature structure of the 3D and 1D models, plotted against the optical depth at 500 nm. For the 3D models structure represents the temporal and spatial mean (over τ500 iso-surfaces). Bottom panels: differences between the 3D model and a given model (legend according to the top panels).
Current usage metrics show cumulative count of Article Views (full-text article views including HTML views, PDF and ePub downloads, according to the available data) and Abstracts Views on Vision4Press platform.
Data correspond to usage on the plateform after 2015. The current usage metrics is available 48-96 hours after online publication and is updated daily on week days.
Initial download of the metrics may take a while.