Fig. 8
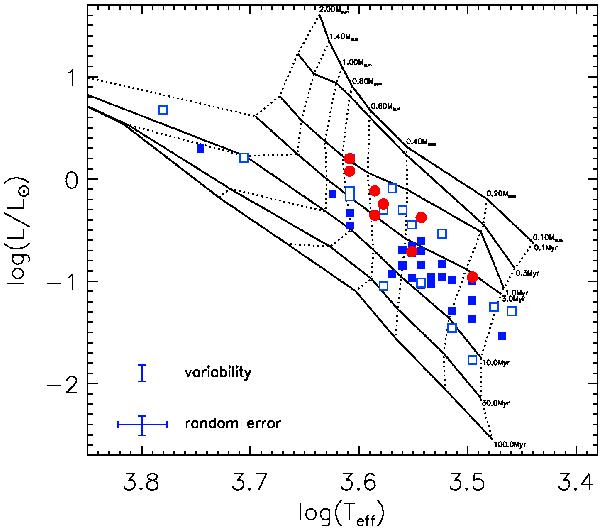
HR diagram with the isochrones of Siess et al. (2000). Filled red circles show spatially unresolved components, either close binary components of visual triple stars or spectroscopic binaries. Luminosities of these targets probably appear to be higher than single stars at the same Teff. Open blue squares show targets with strong near-IR excess (E(Ks−L′) > 0.5 or H−Ks > 0.6) and filled blue squares all other components of the Chamaeleon I sample. In the lower left corner we present the average random error and the luminosity uncertainty introduced by 0.2 mag variability in J -band (estimated from measurements, see Sect. 2.2.2).
Current usage metrics show cumulative count of Article Views (full-text article views including HTML views, PDF and ePub downloads, according to the available data) and Abstracts Views on Vision4Press platform.
Data correspond to usage on the plateform after 2015. The current usage metrics is available 48-96 hours after online publication and is updated daily on week days.
Initial download of the metrics may take a while.