Fig. 18
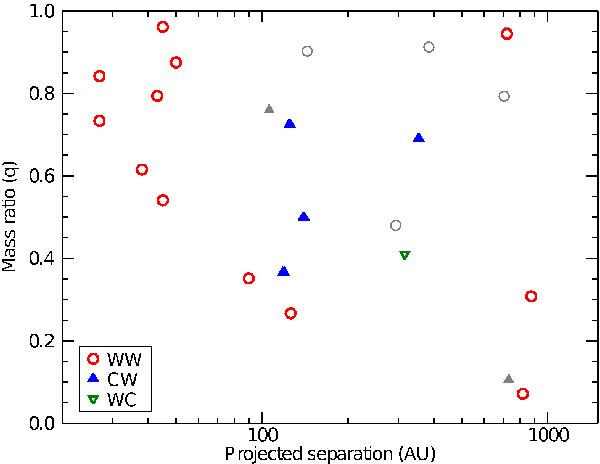
Mass ratio q = Msec/Mprim as a function of binary separation. Red open circles show binaries with two non-accreting components (WW), blue triangles (up) show mixed systems with an accreting primary and green triangles (down) with an accreting secondary from the restricted sample. Gray symbols represent targets that are in the full sample but not in the restricted sample. There are two binaries (Hn 4, T 39 AB10 both WW) where the mass of the fainter component is calculated to be higher than the primary’s mass. The inverse q-1 is plotted for these.
Current usage metrics show cumulative count of Article Views (full-text article views including HTML views, PDF and ePub downloads, according to the available data) and Abstracts Views on Vision4Press platform.
Data correspond to usage on the plateform after 2015. The current usage metrics is available 48-96 hours after online publication and is updated daily on week days.
Initial download of the metrics may take a while.