Free Access
Fig. C.3
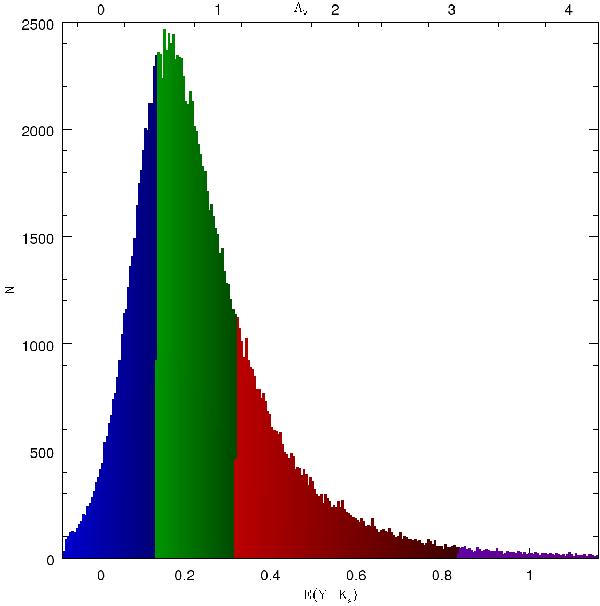
Histogram of E(Y − Ks) (bottom) and AV (top) distribution with bin size of 0.005 mag. Green is the region covering 50% of the sources centred on the median where darker blue is lower than this and brighter red higher and purple extremely high.
Current usage metrics show cumulative count of Article Views (full-text article views including HTML views, PDF and ePub downloads, according to the available data) and Abstracts Views on Vision4Press platform.
Data correspond to usage on the plateform after 2015. The current usage metrics is available 48-96 hours after online publication and is updated daily on week days.
Initial download of the metrics may take a while.