Fig. C.2
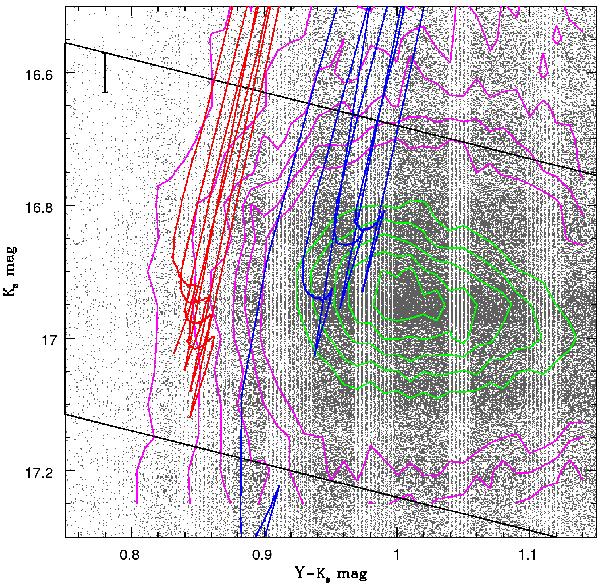
(Y − Ks) vs. Ks CMD with isochrone lines for the helium burning sequence for the same two metallicities and age ranges as Sect. 3.5. Younger, more metal rich (log (t/yr) = 9.0−9.4, Z = 0.0125) are in blue and the older, more metal poor (log (t/yr) = 9.4−9.7, Z = 0.0033) are in red. Error bars represent error in LMC distance. Contours are plotted in magenta and green and have the same levels as in Fig. 4. The older population can be seen to be at the 5% contour level.
Current usage metrics show cumulative count of Article Views (full-text article views including HTML views, PDF and ePub downloads, according to the available data) and Abstracts Views on Vision4Press platform.
Data correspond to usage on the plateform after 2015. The current usage metrics is available 48-96 hours after online publication and is updated daily on week days.
Initial download of the metrics may take a while.