Fig. 23
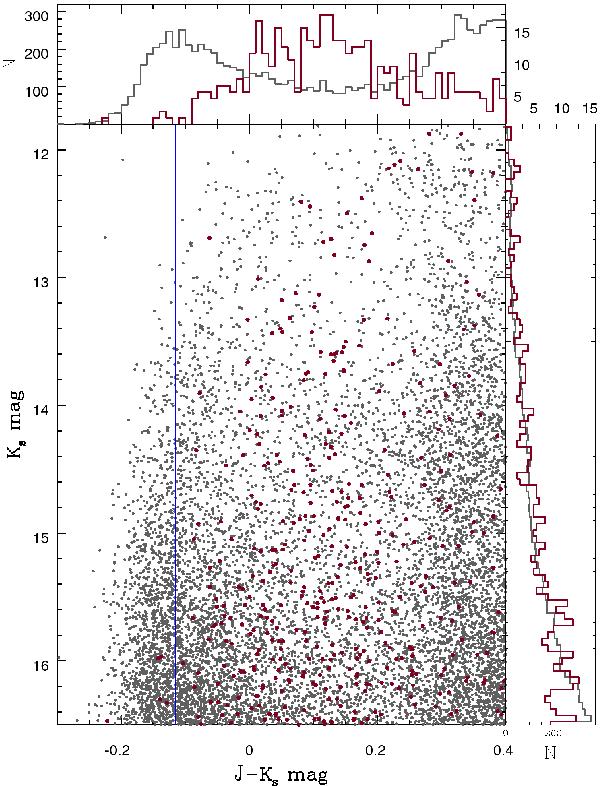
CMD of all stars (grey), stars around R136 (burgundy). Also plotted are histograms of colour and magnitude (bin sizes are the same as used in Fig. 3). Magnitude distribution is similar for both sets. Colour distribution shows an offset of ~ 0.2 mag in the R136 region indicating reddening. Vertical blue line at (J − Ks)0 = − 0.115 mag is the baseline colour.
Current usage metrics show cumulative count of Article Views (full-text article views including HTML views, PDF and ePub downloads, according to the available data) and Abstracts Views on Vision4Press platform.
Data correspond to usage on the plateform after 2015. The current usage metrics is available 48-96 hours after online publication and is updated daily on week days.
Initial download of the metrics may take a while.