Fig. 20
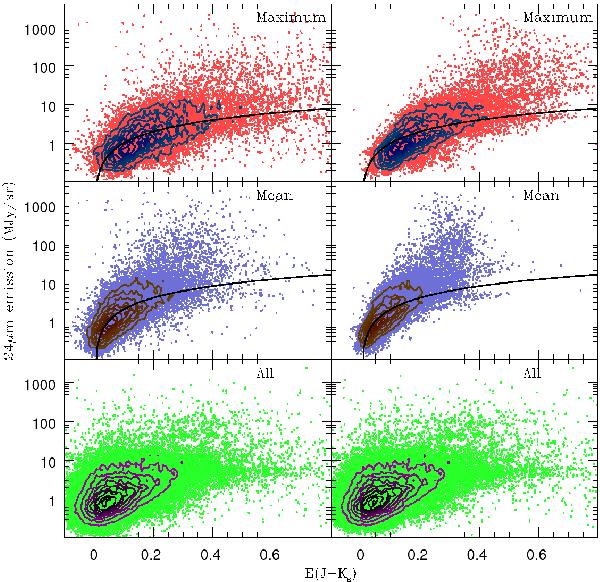
24 μm emission vs. E(J − Ks) extinction for individual method (bottom) and group method means (middle) and maximum (top). Contours represent increasing source density. Right panel applies boxcar smoothing to the data. The linear fits applied are: Emission = 20 × E(J − Ks) MJy/sr to the mean and Emission = 10 × E(J − Ks) MJy/sr to the maximum.
Current usage metrics show cumulative count of Article Views (full-text article views including HTML views, PDF and ePub downloads, according to the available data) and Abstracts Views on Vision4Press platform.
Data correspond to usage on the plateform after 2015. The current usage metrics is available 48-96 hours after online publication and is updated daily on week days.
Initial download of the metrics may take a while.