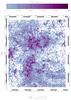
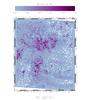
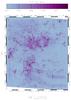
Fig. 19
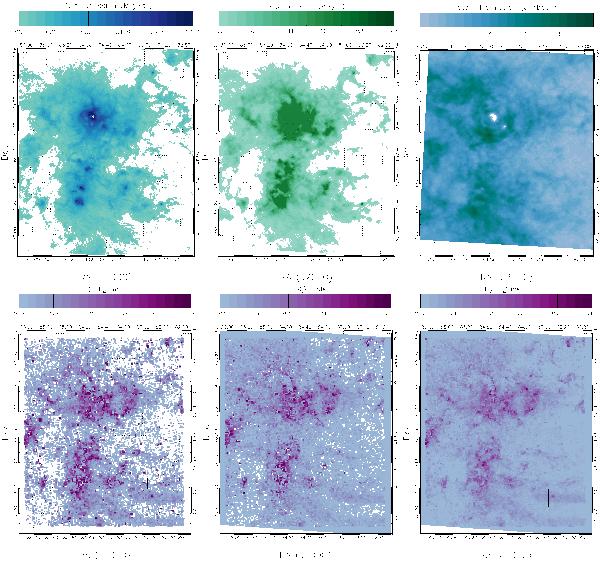
Top-left: the 24 μm FIR maps with emission scale of 1 − 2471 MJy sr. Top-middle: the FIR 70 μm map with emission scale of 30 − 315 MJy sr. Top-right: total H i emission (Jy beam). Sources outside stated limits are omitted from these maps. Bottom: the peak (left), mode (middle) and median (right) extinction map from our data for the tile using the group method. Sources outside of scale are omitted from these maps.
Current usage metrics show cumulative count of Article Views (full-text article views including HTML views, PDF and ePub downloads, according to the available data) and Abstracts Views on Vision4Press platform.
Data correspond to usage on the plateform after 2015. The current usage metrics is available 48-96 hours after online publication and is updated daily on week days.
Initial download of the metrics may take a while.