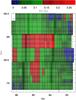
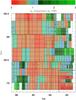
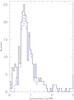
Fig. 15
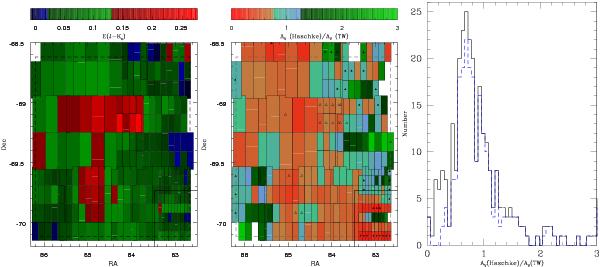
Map of sky showing extinction values (left) and AV(Haschke)/AV(TW) (middle). The dotted outline is the boundary of our tile. Black triangles on a cell indicate that particular cell was made using data that comprise of fewer than 200 stars, detector 16 region outlined in black. Coloured triangles on a cell indicate recalculated extinction ratio (where colour if triangle is recalculated value). Empty cells are where E(J − Ks) ≃ 0 mag (excluded due to producing extreme values in the ratio range). Right: histogram of AV(Haschke)/AV(TW), the dashed blue histogram excludes that detector 16 region.
Current usage metrics show cumulative count of Article Views (full-text article views including HTML views, PDF and ePub downloads, according to the available data) and Abstracts Views on Vision4Press platform.
Data correspond to usage on the plateform after 2015. The current usage metrics is available 48-96 hours after online publication and is updated daily on week days.
Initial download of the metrics may take a while.