Fig. 14
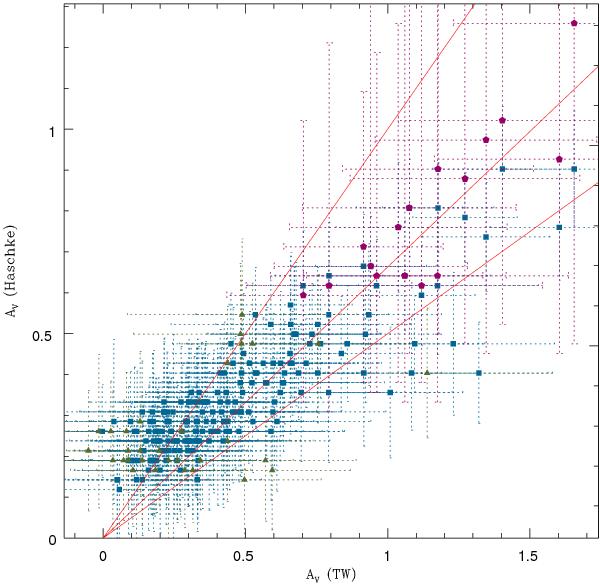
Comparison between AV (Haschke) and AV (TW), conversion from Schlegel et al. (1998) and Sect. 3.6, respectively. Squares indicate regions with over 200 stars while triangles indicate regions with less than 200 stars. Purple hexagons are the values for the recalculated regions. Regions within detector 16 have been excluded from the plot. Red lines represents gradients equal to 1, 0.75 and 0.5.
Current usage metrics show cumulative count of Article Views (full-text article views including HTML views, PDF and ePub downloads, according to the available data) and Abstracts Views on Vision4Press platform.
Data correspond to usage on the plateform after 2015. The current usage metrics is available 48-96 hours after online publication and is updated daily on week days.
Initial download of the metrics may take a while.