Free Access
Fig. 13
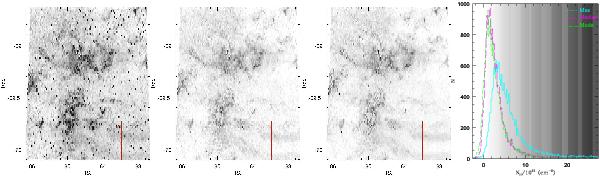
Maps of inferred total H column density for 1′ × 1′ regions of the 6_6 tile. Maps are based on (from left-right) maximum, mode and median extinction. The region containing detector 16 is outlined in red. Histograms of inferred total H column density are shown in the right panel.
Current usage metrics show cumulative count of Article Views (full-text article views including HTML views, PDF and ePub downloads, according to the available data) and Abstracts Views on Vision4Press platform.
Data correspond to usage on the plateform after 2015. The current usage metrics is available 48-96 hours after online publication and is updated daily on week days.
Initial download of the metrics may take a while.