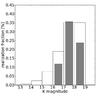
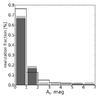
Fig. 10
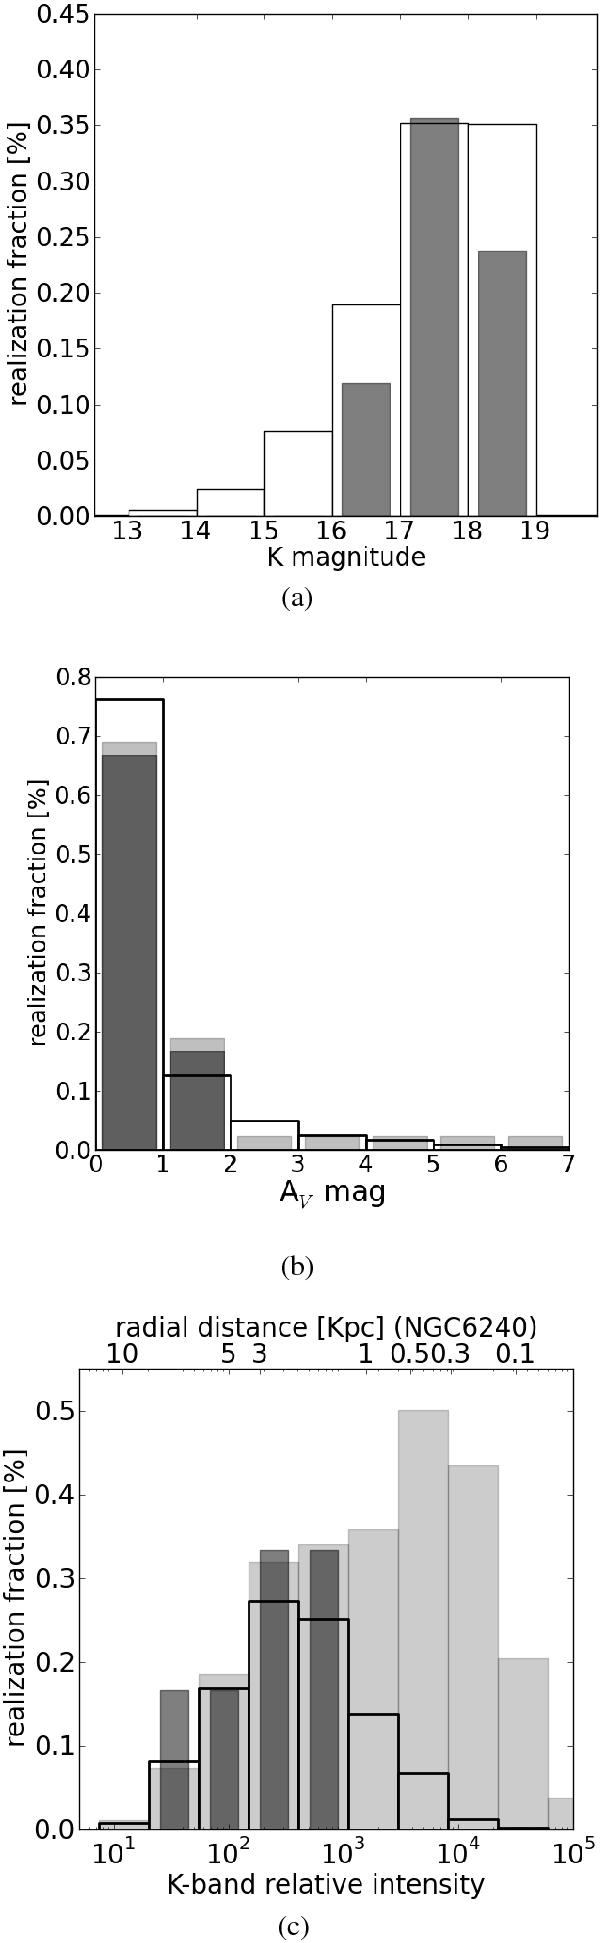
SN property comparison. a) Expected (line-only) and observed (gray) K magnitude distribution at the discovery. b) Expected (line-only) and observed (gray) extinction distribution. In light gray we indicate the allowed range for the extinction of PSN2010 (see text). c) Radial distribution of expected (line-only) and detected (dark grey) SNe. For regular galaxies the surface brightness decreases monotonically with radial distance. The upper axis shows this correspondence for one of the galaxy of our sample. In light gray we show the distribution of injected artificial SNe (see text).
Current usage metrics show cumulative count of Article Views (full-text article views including HTML views, PDF and ePub downloads, according to the available data) and Abstracts Views on Vision4Press platform.
Data correspond to usage on the plateform after 2015. The current usage metrics is available 48-96 hours after online publication and is updated daily on week days.
Initial download of the metrics may take a while.