Fig. 23
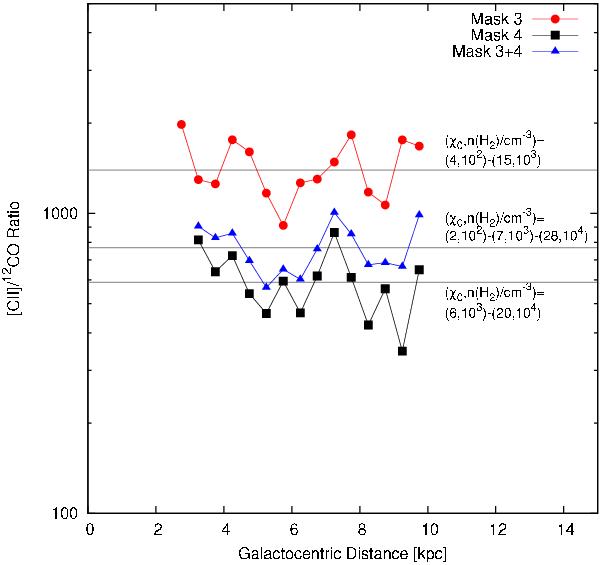
Radial distribution of the [C ii] to 12CO emissivity ratio for Mask 3 (red circles) and Mask 4 (black boxes). We also show the radial distribution of the [C ii]/12CO ratio resulting from the combined emission from Mask 3 and 4 (blue triangles). The horizontal lines correspond to the average value for each mask region between 3−10 kpc. The horizontal lines are labeled with a range of pairs of the FUV field and H2 volume densities (χ0, nH2), that reproduce their corresponding [C ii]/12CO ratio, as predicted by the Kaufman et al. (1999) PDR model. To facilitate the comparison with the PDR model, the ratios were calculated using [C ii] and 12CO emissivities expressed in units of erg s-1 cm-2 sr-1 kpc-1. In these units, typical uncertainties in the ratios are 180, 33, and 35 for Mask 3, Mask 4, and the combined emission from both mask regions, respectively.
Current usage metrics show cumulative count of Article Views (full-text article views including HTML views, PDF and ePub downloads, according to the available data) and Abstracts Views on Vision4Press platform.
Data correspond to usage on the plateform after 2015. The current usage metrics is available 48-96 hours after online publication and is updated daily on week days.
Initial download of the metrics may take a while.