Fig. 3
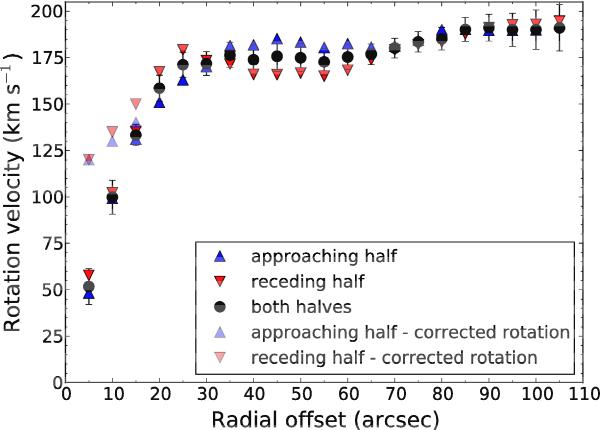
Rotation velocity vs. radial distance from the center. The blue triangles describe the approaching half of the galaxy, the red triangles the receding half, and the black dots both halves in a common calculation with the sigma of the velocity given by ROTCUR as error bars. The semi-transparent triangles in blue and red describe the corrected rotation of the approaching and the receding half for the final model, respectively.
Current usage metrics show cumulative count of Article Views (full-text article views including HTML views, PDF and ePub downloads, according to the available data) and Abstracts Views on Vision4Press platform.
Data correspond to usage on the plateform after 2015. The current usage metrics is available 48-96 hours after online publication and is updated daily on week days.
Initial download of the metrics may take a while.