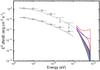
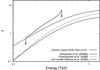
Fig. 4

HE and VHE spectra of PKS 1510−089 measured with Fermi-LAT and H.E.S.S., and upper limits on the EBL induced opacity. Left: the filled butterfly shows the H.E.S.S. spectrum as a 1σ confidence band; the blue and red butterflies shows the spectrum corrected for EBL absorption, using the low model for the EBL from Gilmore et al. (2009) and the upper-limit EBL model from Aharonian et al. (2006a) respectively. The triangles show the long-term average Fermi-LAT spectrum, with error bars denoting 1σ statistical errors; the solid curve is the log-parabola model obtained from a binned likelihood analysis of these data (see text for details). The open squares show the Fermi-LAT spectrum derived from the integration period between MJD 54 914.8 and MJD 54 917.5 (error bars illustrate 1σ statistical errors). Arrows denote upper limits on the flux for those bins where insufficient statistics prohibits a flux measurement. The dashed curve is obtained by re-normalizing the long-term average Fermi-LAT spectrum to the level of the high-flux state. Right: upper limits on the EBL opacity derived from spectral measurements of PKS 1510−089 compared to published models. The solid line with arrows at both ends shows the maximum optical depth, corresponding to upper limits on the EBL. For comparison the opacity corresponding to the previously published H.E.S.S. upper-limit EBL model Aharonian et al. (2006a), the Franceschini et al. (2008) model and the low model from Gilmore et al. (2009) are shown.
Current usage metrics show cumulative count of Article Views (full-text article views including HTML views, PDF and ePub downloads, according to the available data) and Abstracts Views on Vision4Press platform.
Data correspond to usage on the plateform after 2015. The current usage metrics is available 48-96 hours after online publication and is updated daily on week days.
Initial download of the metrics may take a while.