Fig. 5
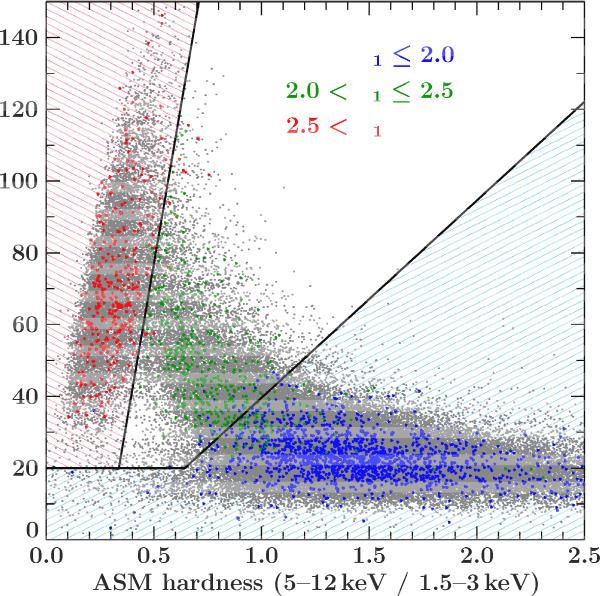
PCA to ASM mapping. Gray data points are all ASM measurements of Cyg X-1 in the shown range. Blue points represent PCA defined hard states, green intermediate and red soft states. Black lines show the cuts defining the states in the ASM HID. The light blue shaded region corresponds to the position of the hard state in the HID, the light red shaded to the position of the soft state. The intermediate state region is shown without shading.
Current usage metrics show cumulative count of Article Views (full-text article views including HTML views, PDF and ePub downloads, according to the available data) and Abstracts Views on Vision4Press platform.
Data correspond to usage on the plateform after 2015. The current usage metrics is available 48-96 hours after online publication and is updated daily on week days.
Initial download of the metrics may take a while.