Fig. 1
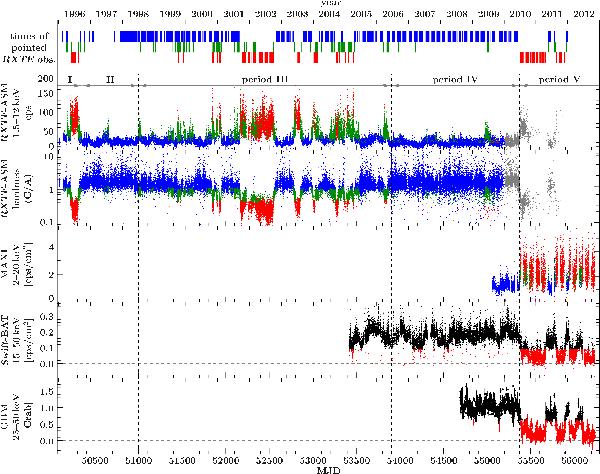
Pointed RXTE observations and all light curves (RXTE-ASM, MAXI, Swift-BAT, and GBM) of Cyg X-1 used in this analysis. ASM, MAXI, and BAT data are shown in the highest available resolution, GBM are binned daily. ASM hardness is calculated by dividing count rates in band C (5.0−12 keV) by count rates in band A (1.5−3.0 keV). Vertical dashed lines and horizontal arrows represent periods of different source activity patterns. Blue, green, and red colors represent states of individual measurements classified using the respective classification for the different instruments as introduced in Sect. 3: blue represents the hard state, green the intermediate state and red the soft state. ASM data after MJD 55200 (shown in gray) are affected by intrumental decline. Hard and intermediate states cannot be separated in BAT and GBM; BAT and GBM data corresponding to these periods of hard or intermediate states are therefore shown in black.
Current usage metrics show cumulative count of Article Views (full-text article views including HTML views, PDF and ePub downloads, according to the available data) and Abstracts Views on Vision4Press platform.
Data correspond to usage on the plateform after 2015. The current usage metrics is available 48-96 hours after online publication and is updated daily on week days.
Initial download of the metrics may take a while.