Free Access
Fig. 6
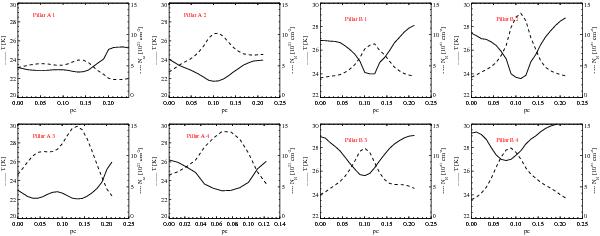
Temperature and column density profiles among the cuts (from left to right, i.e., in east to west direction) of the prominent pillars highlighted in Fig. 5. The solid lines represent the temperature profiles and dashed lines the column density.
Current usage metrics show cumulative count of Article Views (full-text article views including HTML views, PDF and ePub downloads, according to the available data) and Abstracts Views on Vision4Press platform.
Data correspond to usage on the plateform after 2015. The current usage metrics is available 48-96 hours after online publication and is updated daily on week days.
Initial download of the metrics may take a while.