Fig. 2
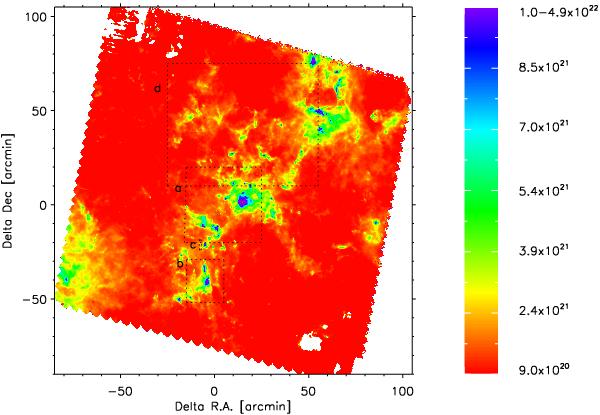
Column density map of the Carina nebula. The color scale is expressed in cm-2. The dashed boxes represent the central region around η Car (box a), the Southern Pillars region (box b), the Treasure Chest Cluster (box c), and the wave pattern (box d). These regions are analyzed in detail in Figs. 4, 5, 7, and 8. The center of the figure corresponds to the position (αJ2000, δJ2000) = (10h45m21s, −59°34′20′′).
Current usage metrics show cumulative count of Article Views (full-text article views including HTML views, PDF and ePub downloads, according to the available data) and Abstracts Views on Vision4Press platform.
Data correspond to usage on the plateform after 2015. The current usage metrics is available 48-96 hours after online publication and is updated daily on week days.
Initial download of the metrics may take a while.