Free Access
Fig. 4
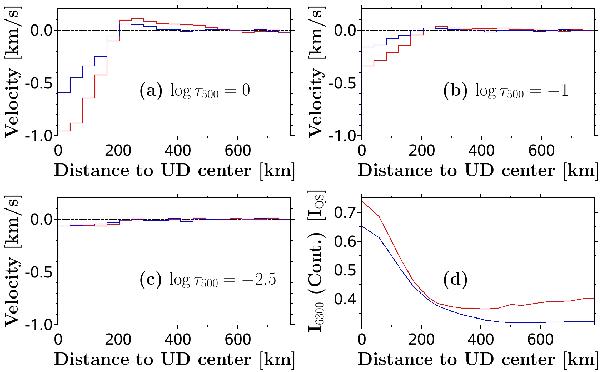
Panels a)–c): LOS velocity at constant optical depth as function of the distance to the UD center averaged over all azimuthal angles of the peripheral (red lines) and central (blue lines) UDs. The optical depths are given as text labels. Panel d): mean continuum intensity profile of the two UD classes.
Current usage metrics show cumulative count of Article Views (full-text article views including HTML views, PDF and ePub downloads, according to the available data) and Abstracts Views on Vision4Press platform.
Data correspond to usage on the plateform after 2015. The current usage metrics is available 48-96 hours after online publication and is updated daily on week days.
Initial download of the metrics may take a while.