Fig. 2
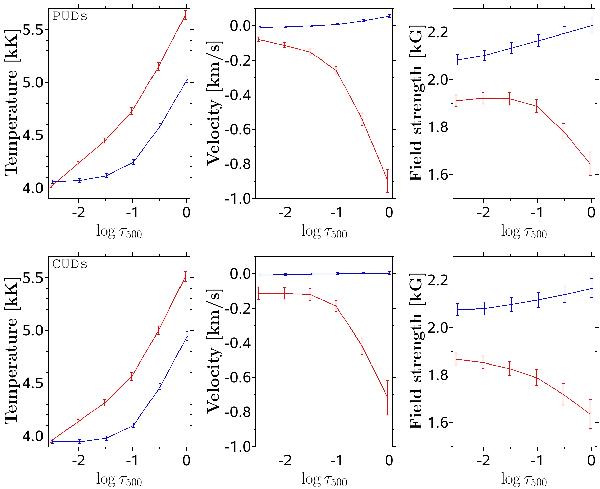
Optical-depth dependence of temperature, LOS velocity, and magnetic field strength averaged over 44 peripheral umbral dots (top three panels) and 23 central umbral dots (bottom three panels). The error bars denote standard deviations of the mean (σ/ ). The red lines exhibit the stratifications of the mean UD, while the blue lines correspond to the mean nearby diffuse background (see main text for details). Negative LOS velocity values indicate upflows.
Current usage metrics show cumulative count of Article Views (full-text article views including HTML views, PDF and ePub downloads, according to the available data) and Abstracts Views on Vision4Press platform.
Data correspond to usage on the plateform after 2015. The current usage metrics is available 48-96 hours after online publication and is updated daily on week days.
Initial download of the metrics may take a while.