Fig. 1
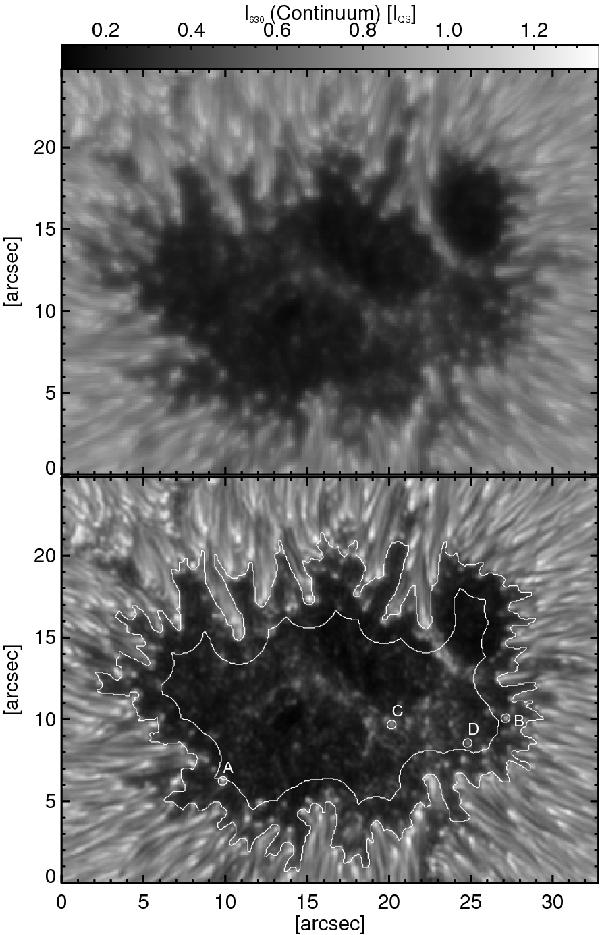
Stokes I continuum intensity of the Hinode/SP map of a sunspot umbra of NOAA AR 10933. The original data are plotted in the top panel. The Stokes I continuum resulting from the 2D inversion is shown in the bottom panel. The intensity is normalized to the mean quiet-Sun intensity IQS. The outer contour line in the bottom panel indicates the edge of the umbra as retrieved from the magnetic field inclination map (see main text), the inner contour line separates central from peripheral umbral dots (UDs). Four typical UDs are marked by circles and letters.
Current usage metrics show cumulative count of Article Views (full-text article views including HTML views, PDF and ePub downloads, according to the available data) and Abstracts Views on Vision4Press platform.
Data correspond to usage on the plateform after 2015. The current usage metrics is available 48-96 hours after online publication and is updated daily on week days.
Initial download of the metrics may take a while.