Fig. 5
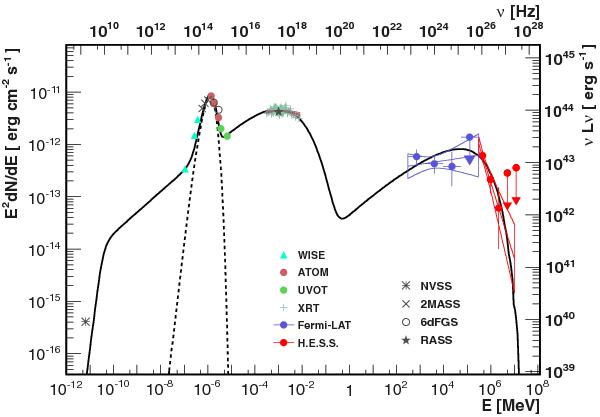
Radio-to-TeV spectral energy distribution of SHBL J001355.9–185406 with ATOM (red circles, Table 2), Swift-UVOT (green circles), Swift-XRT (green cross + brown lines, Table 1), Fermi-LAT (blue), and H.E.S.S. (red) measurements. Archival data from NVSS, 2MASS, 6dFGS, and RASS are shown in grey. The dashed line is the black-body spectrum from the host galaxy at a temperature of 4500 K, and the black line shows the sum of the SSC calculation and the black-body spectrum.
Current usage metrics show cumulative count of Article Views (full-text article views including HTML views, PDF and ePub downloads, according to the available data) and Abstracts Views on Vision4Press platform.
Data correspond to usage on the plateform after 2015. The current usage metrics is available 48-96 hours after online publication and is updated daily on week days.
Initial download of the metrics may take a while.