Fig. 3
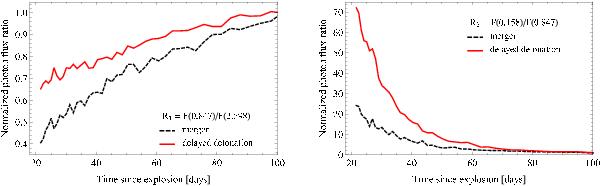
Peak line flux ratios of the gamma-ray emission from the delayed detonation (red) and the violent merger model (dashed black). The graph on the left depicts the line ratio R1 = F(0.847 MeV)/F(2.598 MeV) of two 56Co lines, the graph on the right illustrates the line ratio R2 = F(0.158 MeV)/F(0.847 MeV) of a 56Ni and a 56Co line. The flux ratios are normalized to the optically thin limit.
Current usage metrics show cumulative count of Article Views (full-text article views including HTML views, PDF and ePub downloads, according to the available data) and Abstracts Views on Vision4Press platform.
Data correspond to usage on the plateform after 2015. The current usage metrics is available 48-96 hours after online publication and is updated daily on week days.
Initial download of the metrics may take a while.