Fig. 1
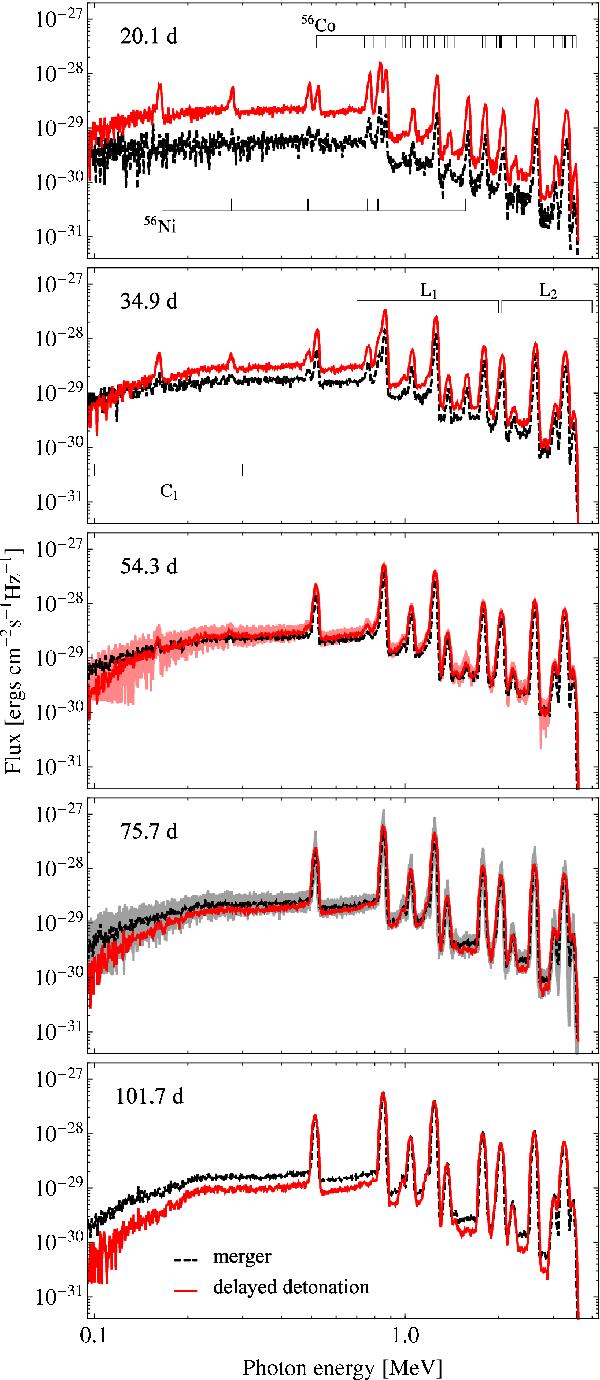
Spectral evolution of the gamma-ray emission from the delayed detonation (red) and the violent merger model (dashed black) for different epochs after the explosion (indicated in the upper left of each panel). The spectral spread due to different viewing angles is shown for the maximum-light epochs of the two models in gamma rays (indicated in light red for the delayed detonation model in the third panel and in gray for the merger model in the fourth panel). Part of the effect is obscured by Monte Carlo noise in particular in the continuum. This problem is largely removed by using hardness ratios and broadband light curves. The 56Ni and 56Co emission lines are indicated in the first panel, and the flux bands C1, L1, and L2 discussed in Sect. 3.2 are depicted in the second panel.
Current usage metrics show cumulative count of Article Views (full-text article views including HTML views, PDF and ePub downloads, according to the available data) and Abstracts Views on Vision4Press platform.
Data correspond to usage on the plateform after 2015. The current usage metrics is available 48-96 hours after online publication and is updated daily on week days.
Initial download of the metrics may take a while.