Fig. 9
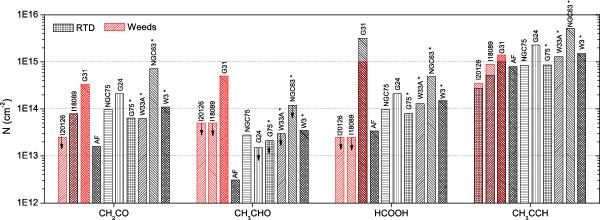
Beam-averaged column densities for cold molecules in sources observed in this study and those from BIS07. Sources without disk structure are marked with an asterisk. Column densities from the RTD analysis are marked in black bars while the red bars show column densities from the Weeds model. Upper limits are indicated with arrows.
Current usage metrics show cumulative count of Article Views (full-text article views including HTML views, PDF and ePub downloads, according to the available data) and Abstracts Views on Vision4Press platform.
Data correspond to usage on the plateform after 2015. The current usage metrics is available 48-96 hours after online publication and is updated daily on week days.
Initial download of the metrics may take a while.